Appearance
Core Reporting
The Core Reporting module allows users to define and schedule automated reports based on selected data paths. Users can specify which folders or files to include or exclude, assign a report name, and configure the execution frequency.
Configuration
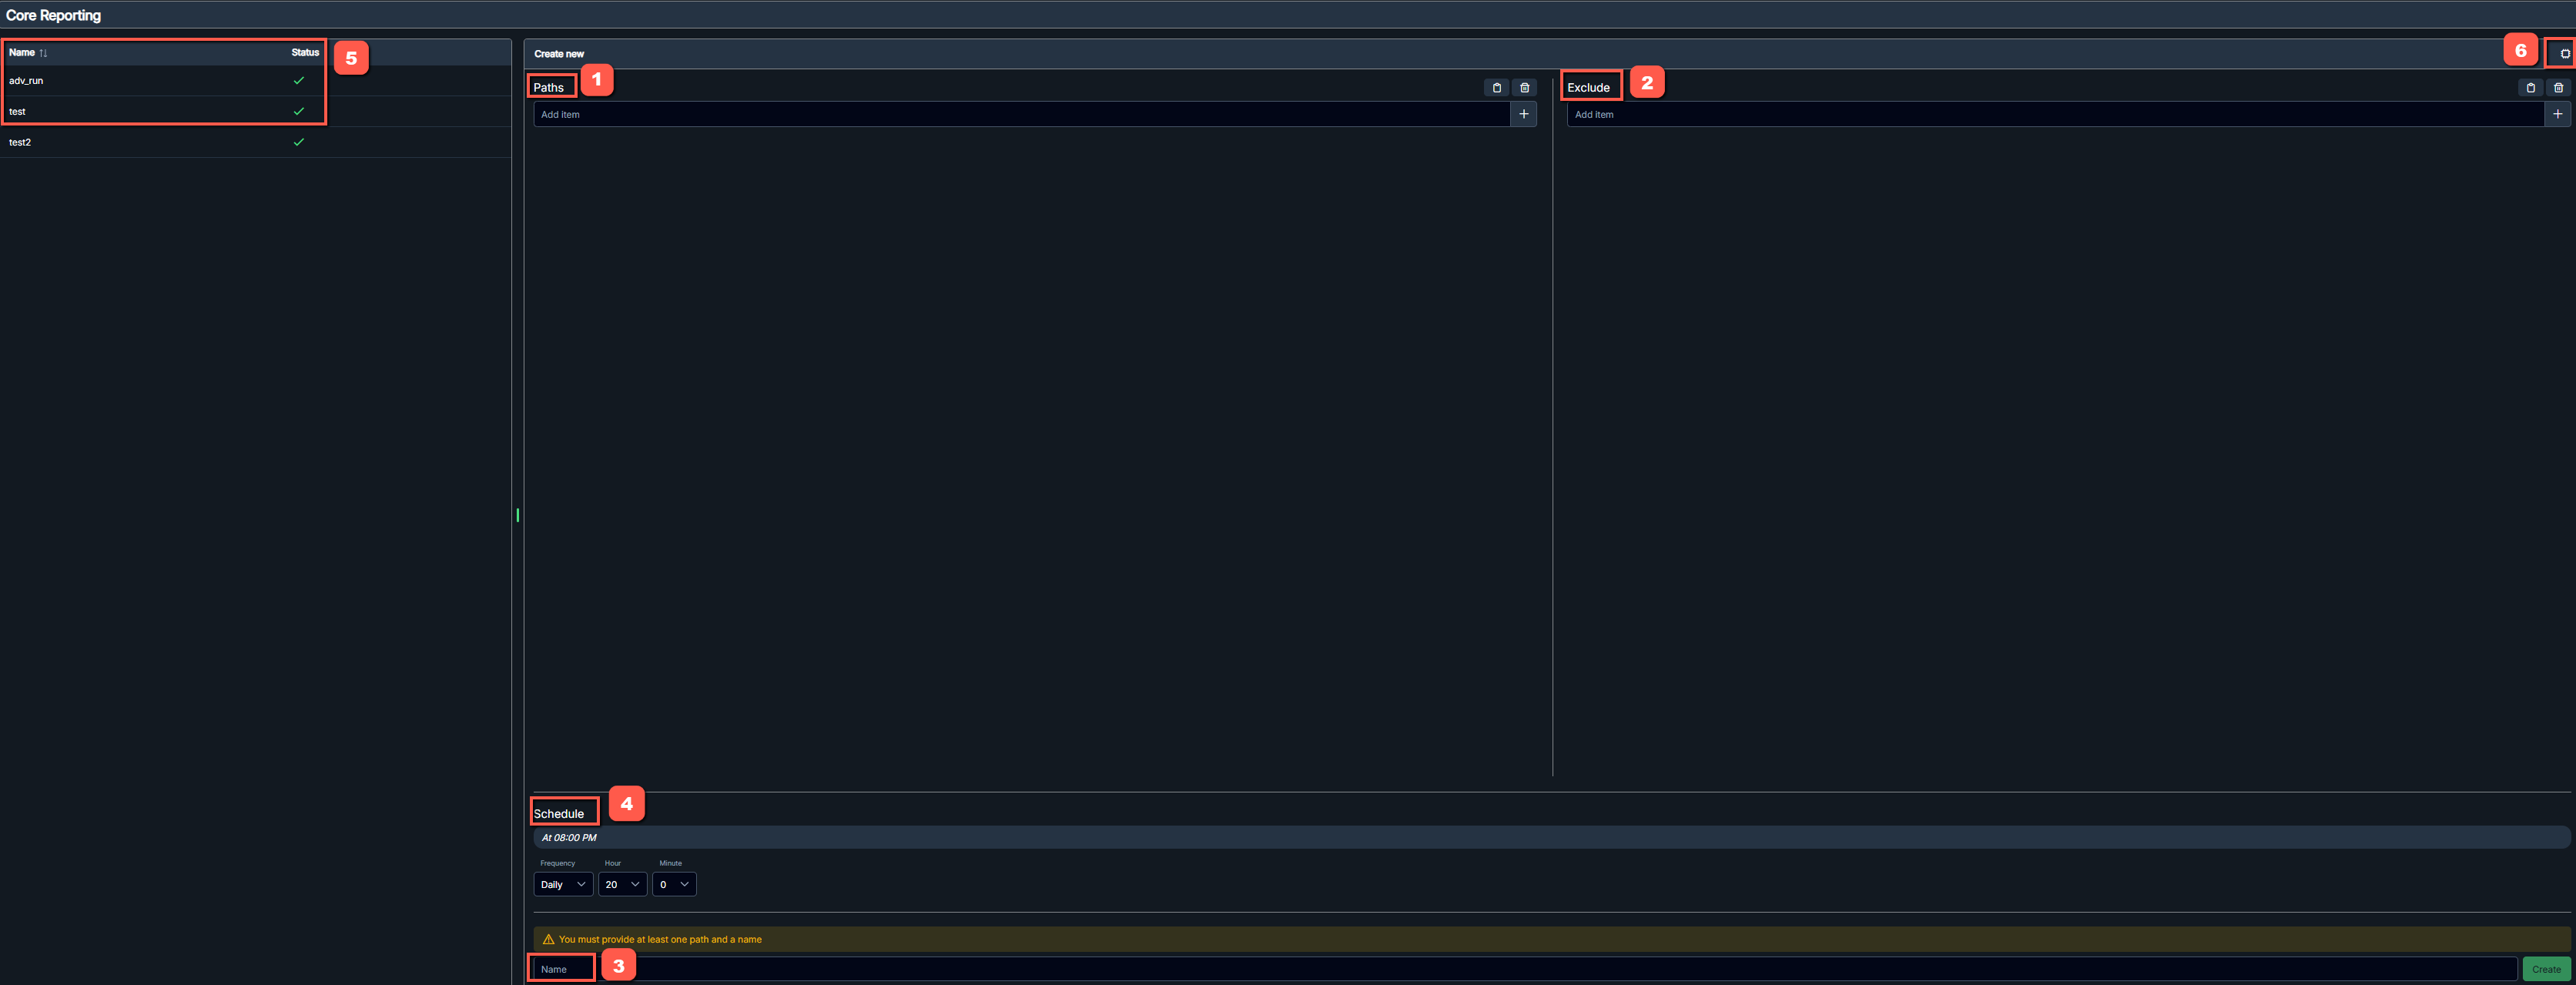
The main components of the Core Reporting window are outlined below:
Paths - Specify one or more file paths or directories to include in the report. After entering the path, press Enter key on the keyboard or click the
 to add it. Click the
  to clear all entered paths. Click the
  to paste a list of paths.
Both local and network paths are supported.Exclude - Specify any files to be excluded from the reporting process. Users can enter keywords or strings to filter out items, for example: snapshot, backup.

Name - Enter a descriptive name for the report. A name is required before creating and scheduling the crawl.
Schedule - Configure the execution frequency. Users can set the desired schedule (e.g., daily at 20:00, weekly, monthly, or a cron expression).
Report list - Displays all saved reports with their names and current status. The status indicator confirms whether the report has been successfully created and scheduled.
Advanced settings - Provides additional configuration options.
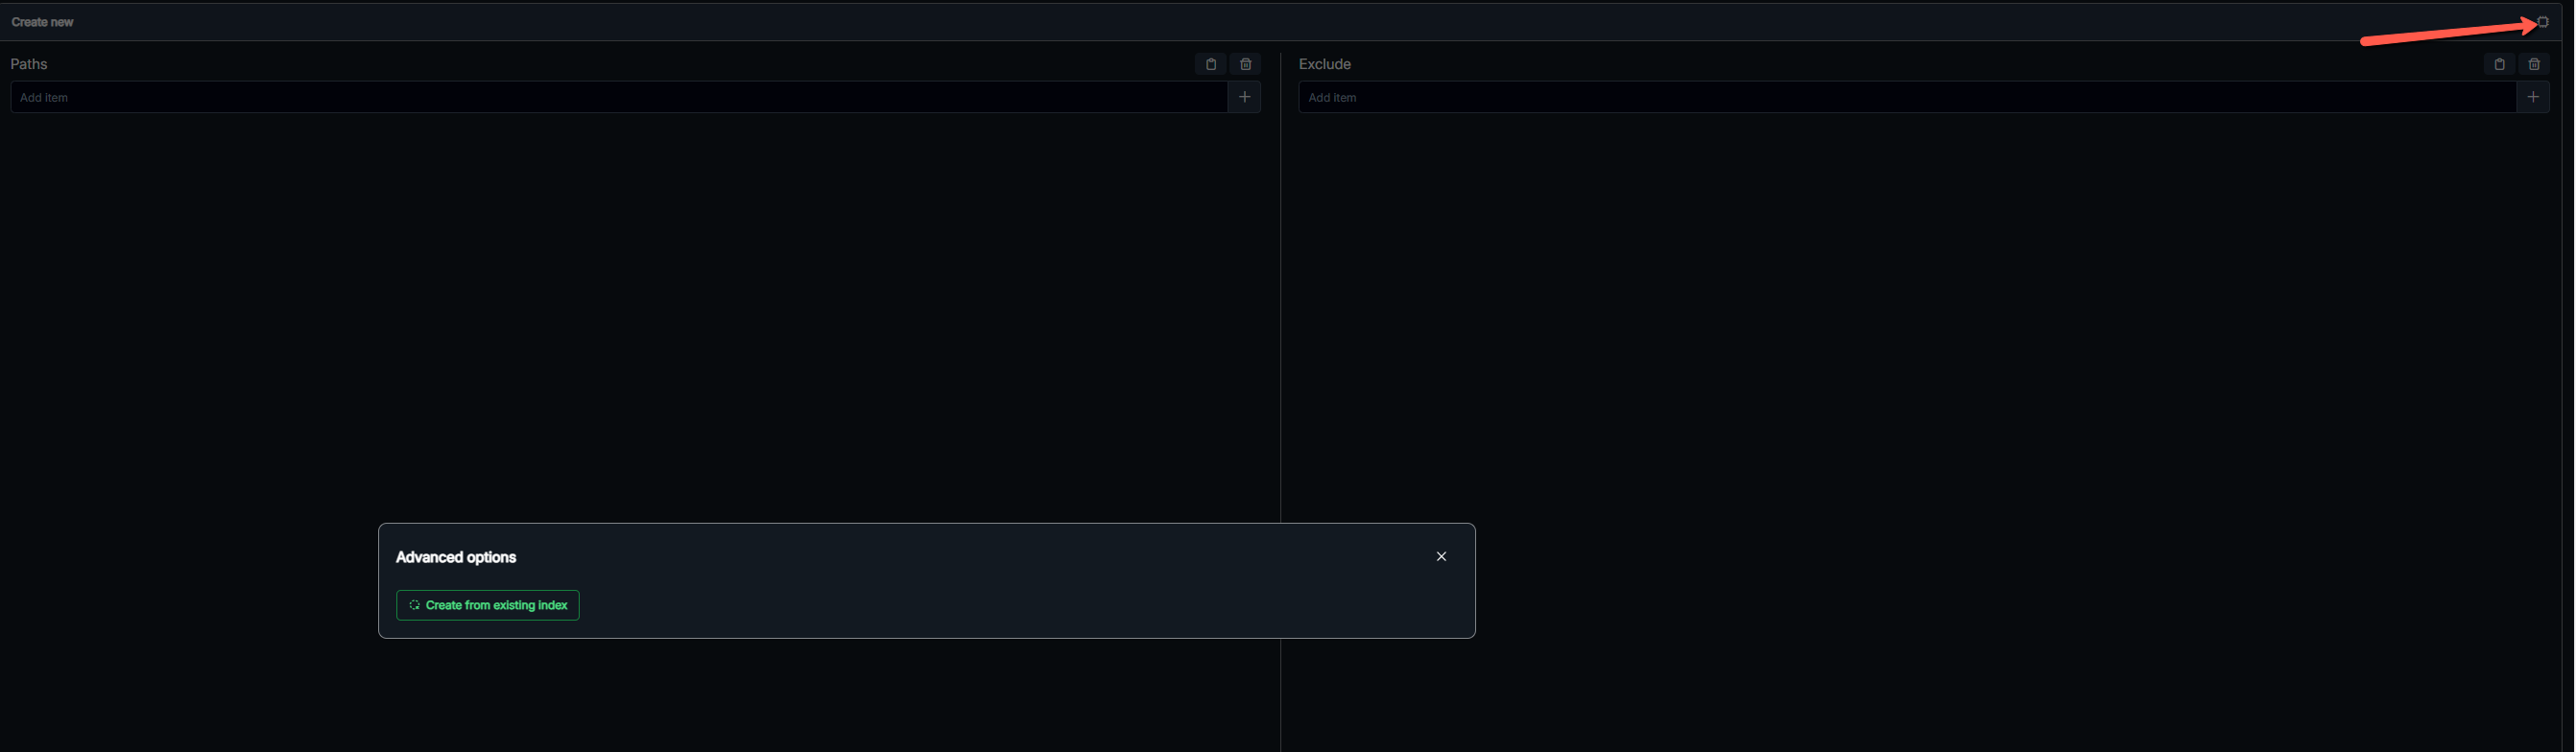
Users can create a report from an existing index. 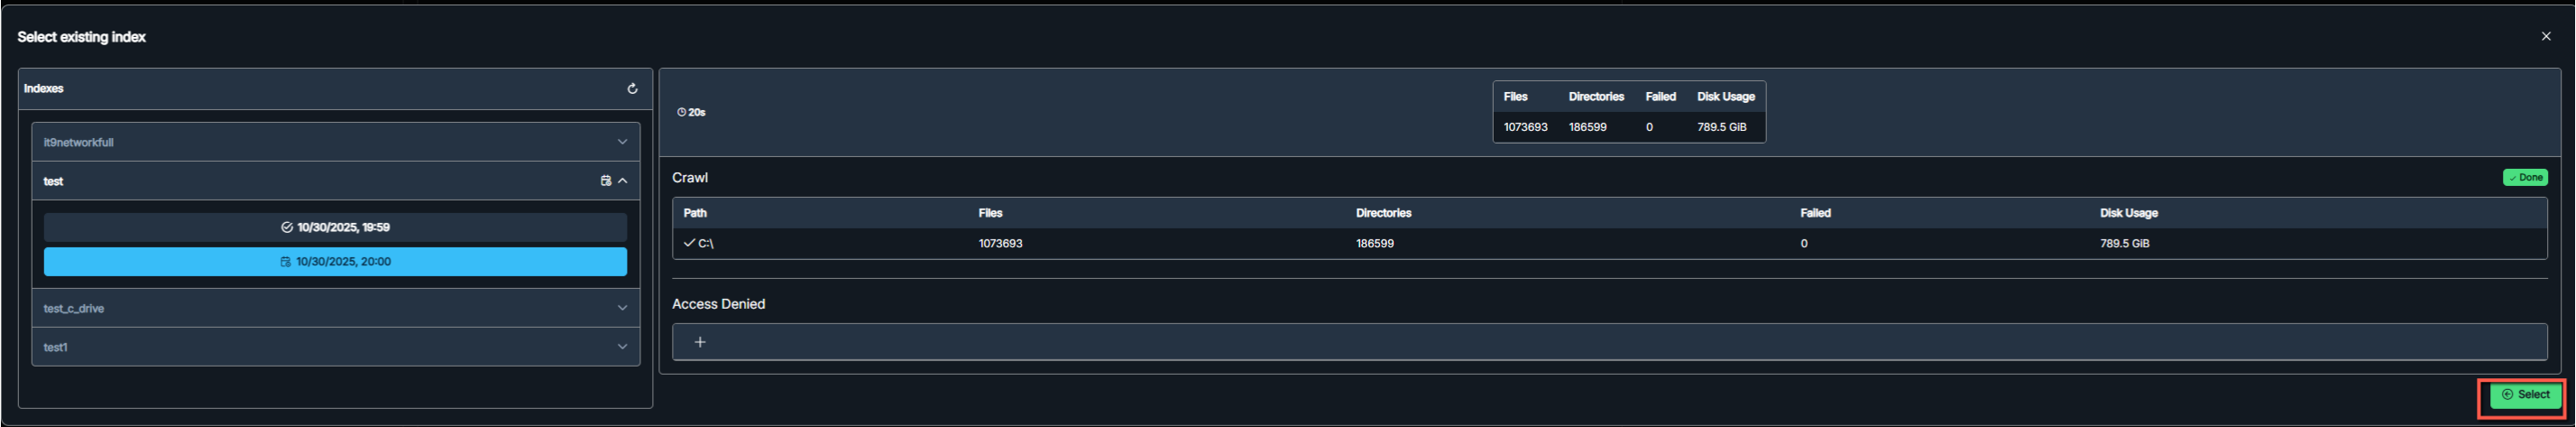
When scheduling a crawl, enter a name, select the frequency, and create the task. 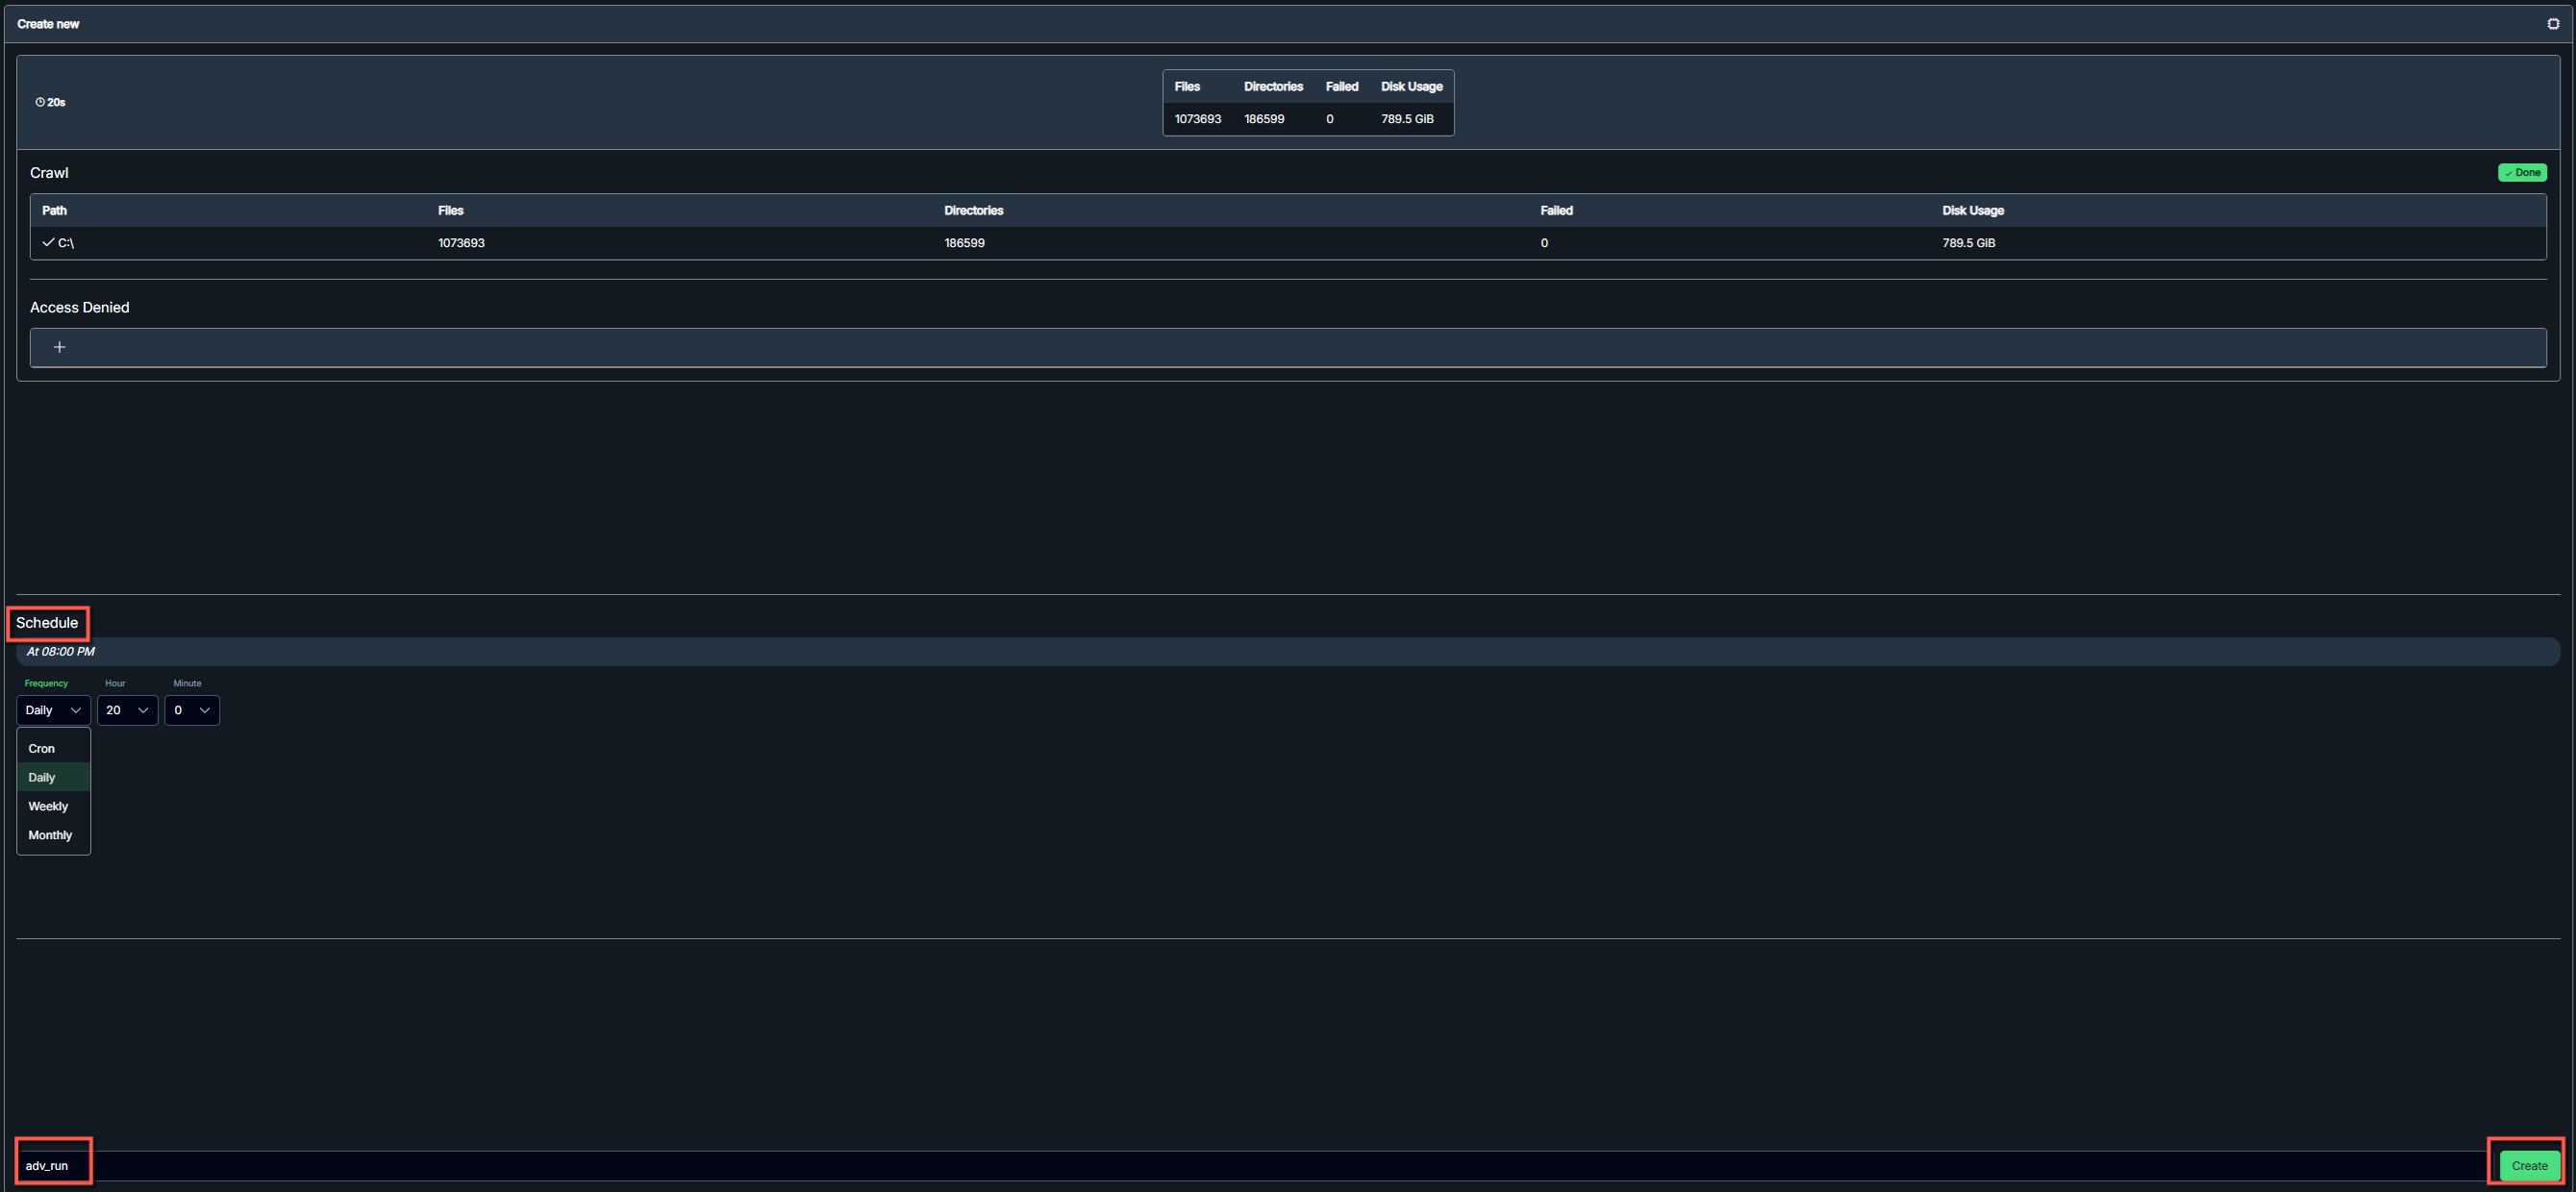
Once created, the task will appear in the Report List, and users can view the results. 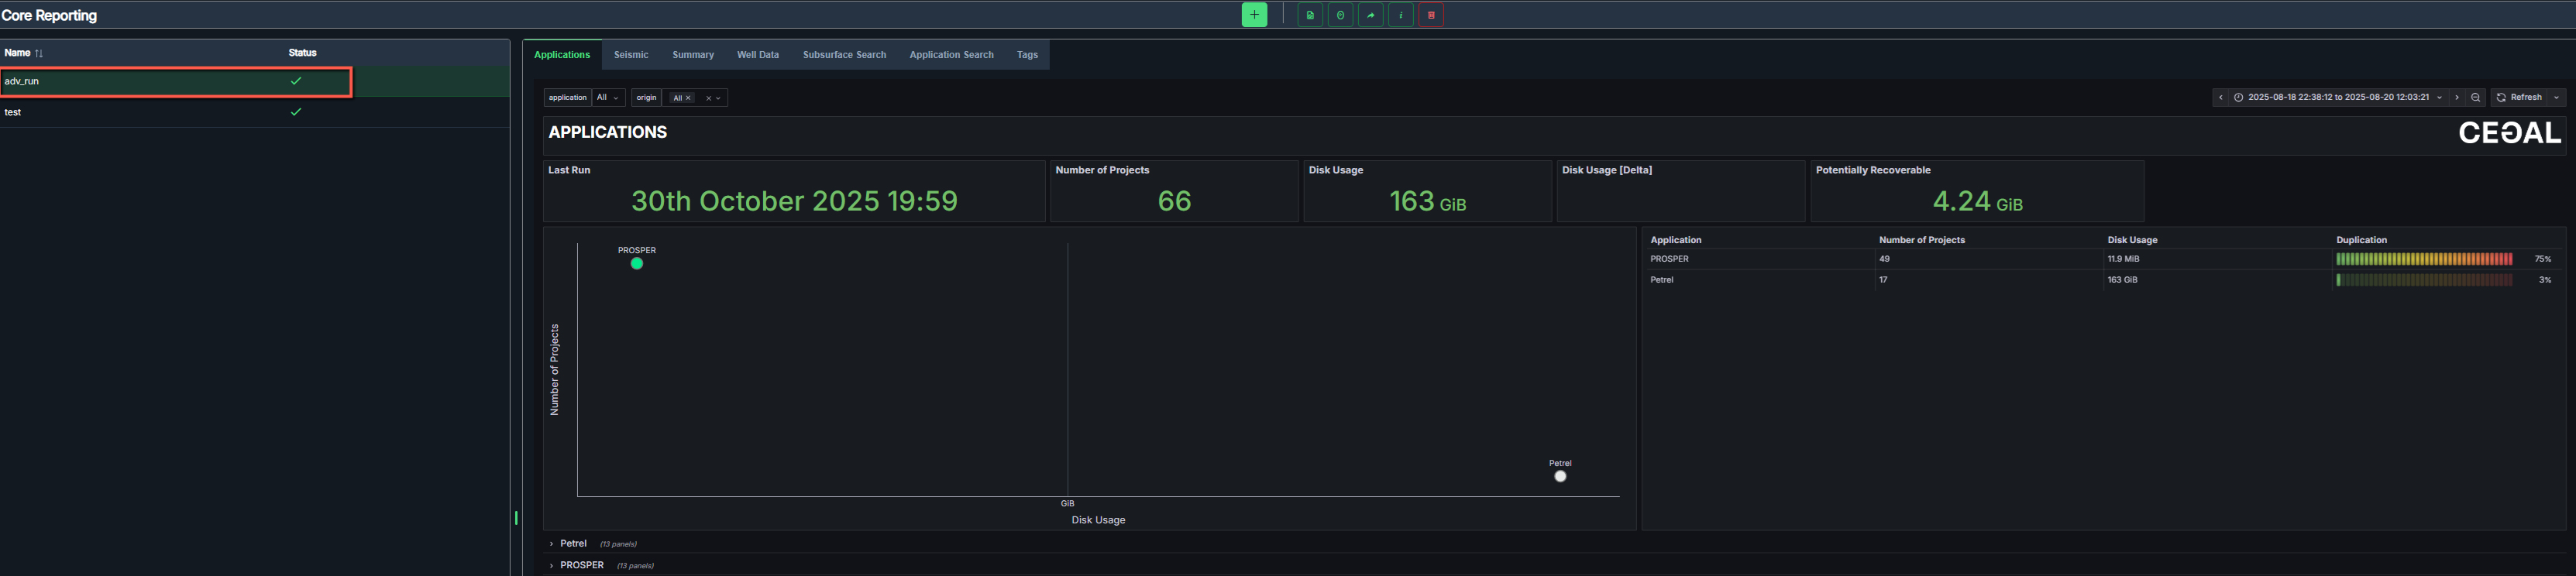
Toolbar
At the top of the report, a toolbar provides quick access to reporting functions: 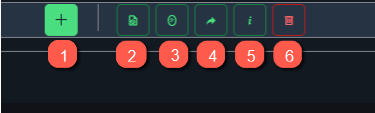
Create new - Create a new crawl.
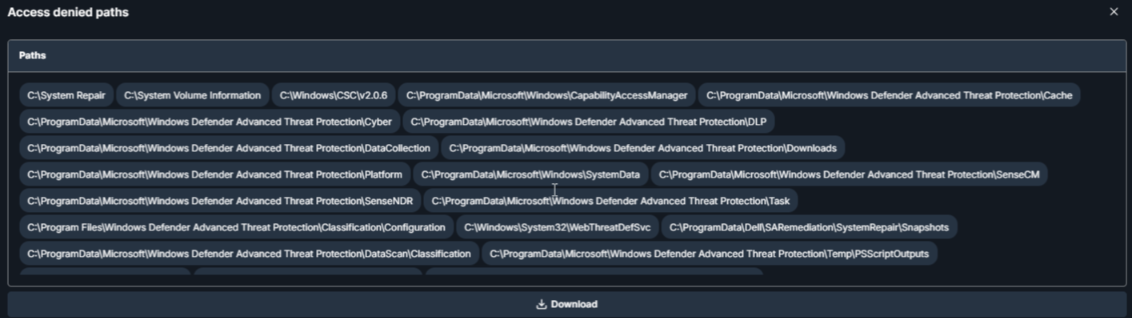
Access denied path - Returns a list of paths where access is restricted; list can be downloaded as .txt file.
Mirrored directories - Shows directories that contain mirrored or duplicated structures.

Copy sharable link - Generates a shareable link for quick access to the current view.
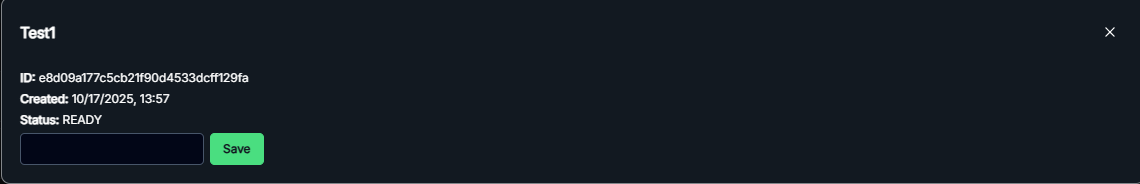
Project info - Displays project ID, creation time, and status.
Delete project - Deletes the current project.
Results
The results are presented through dashboards and tables.
The dashboards include:
- Applications
- Seismic
- Summary
- Well Data
Tables are available for:
- Subsurface Data
- Application Data
An additional tab is available to review and manage all tags. 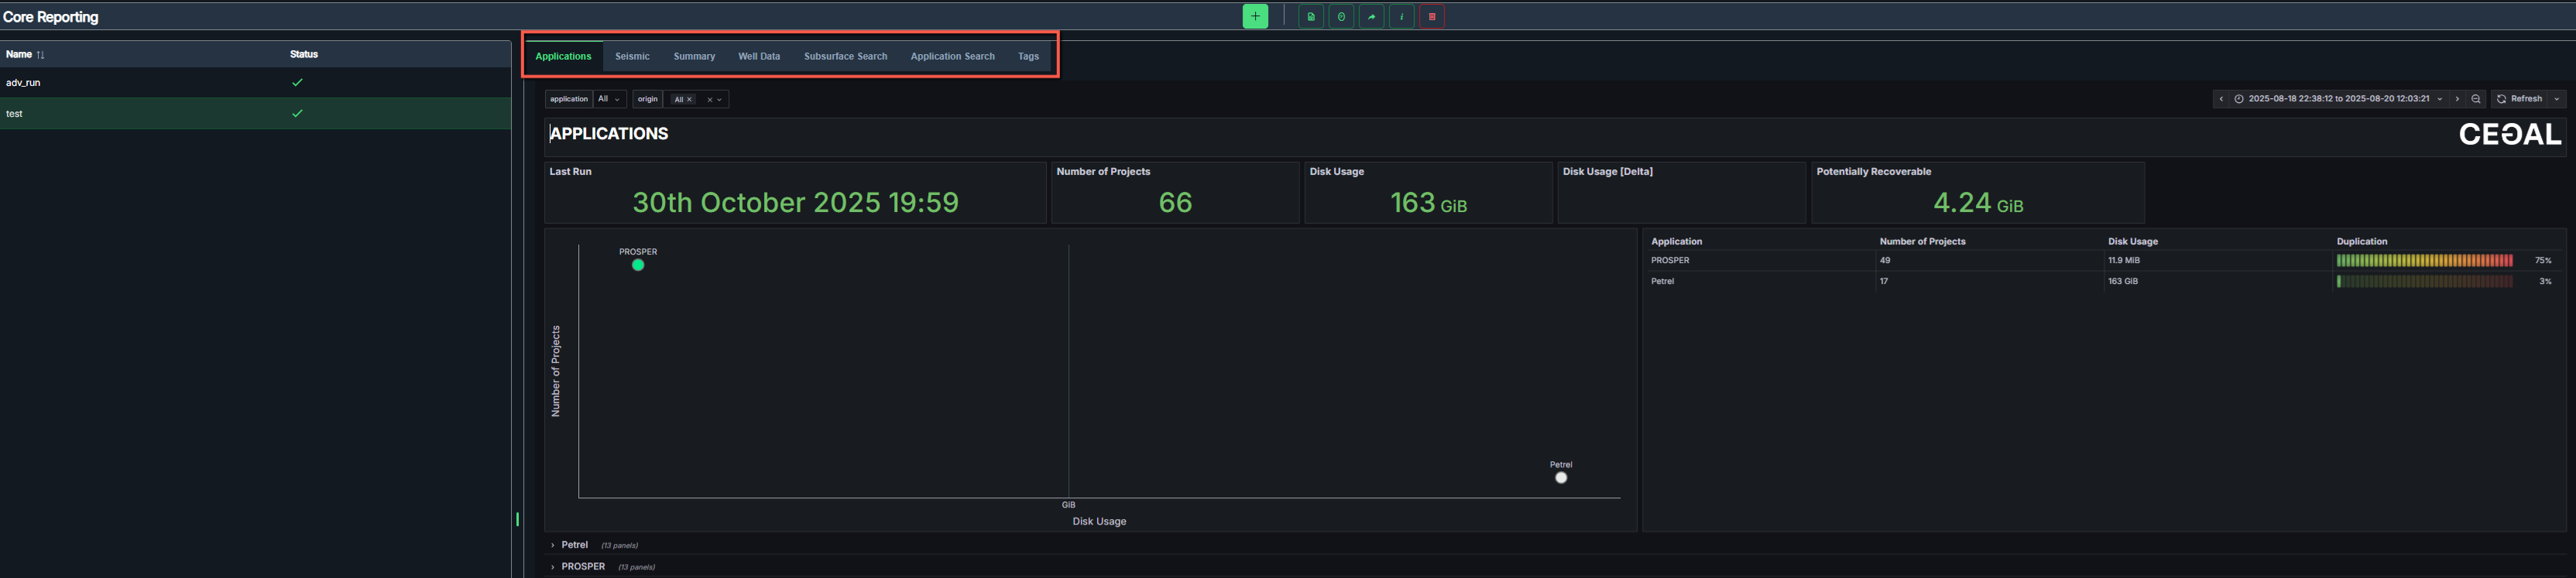
Application view
The Applications dashboard provides an overview of all detected application projects. It summarizes project count, disk usage, potential recoverable space, and duplication statistics for each application. 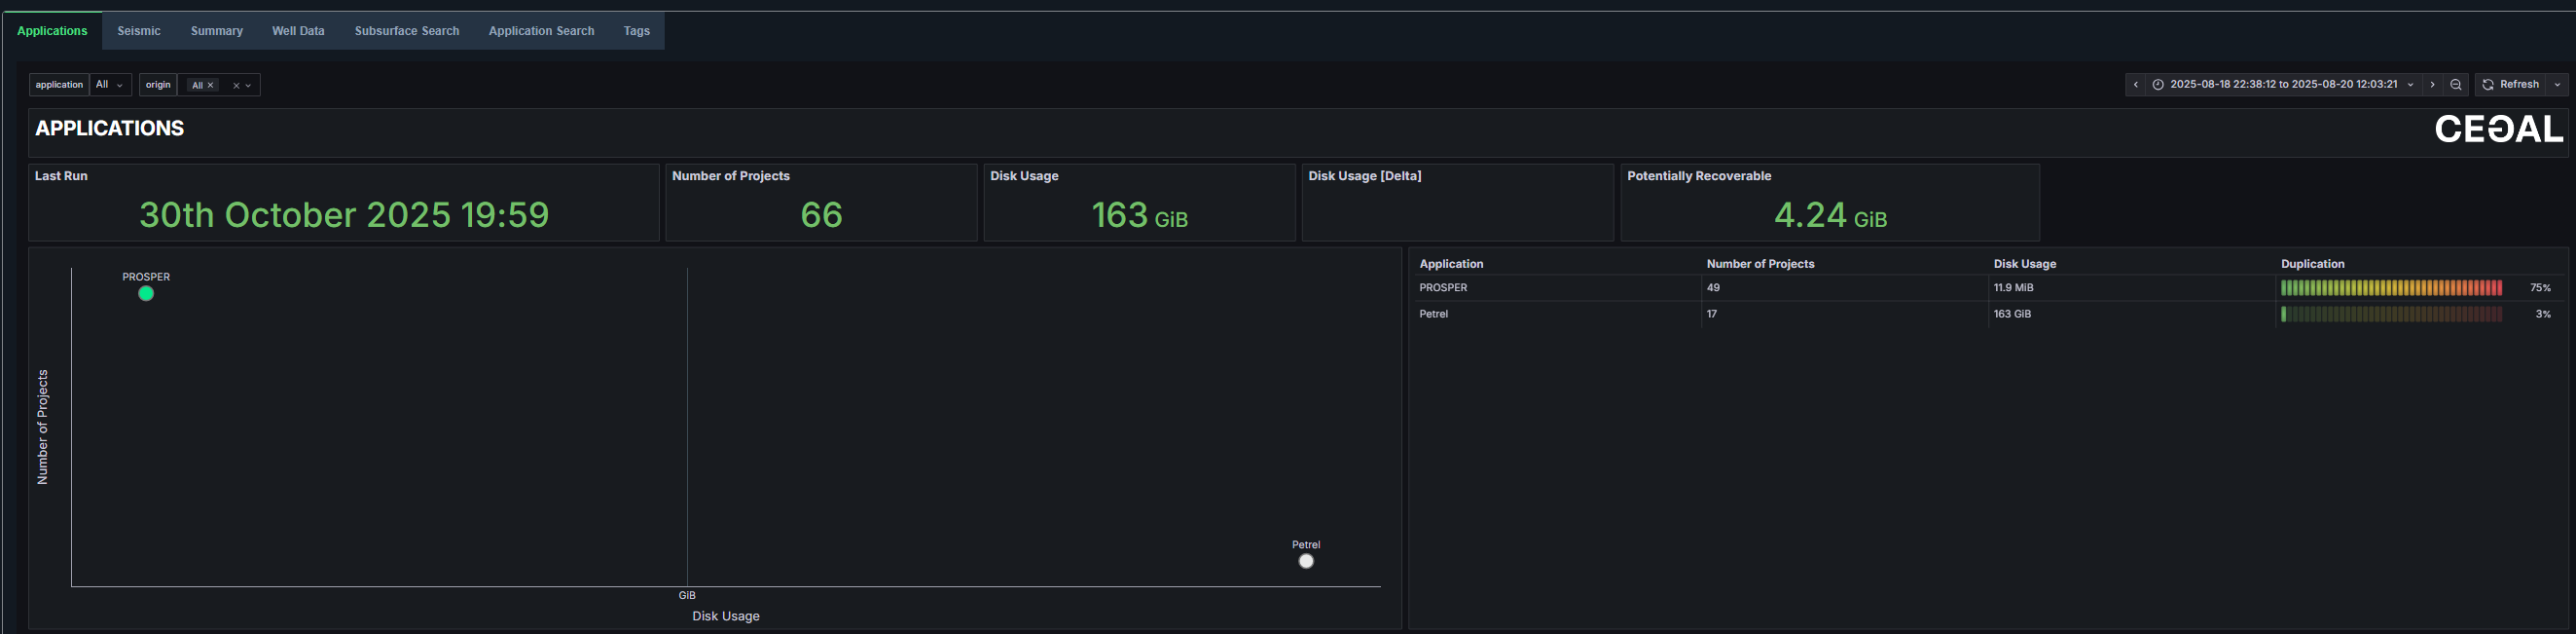
Dashboard components
- Last Run - The timestamp of the last crawl.
- Number of Projects - Total projects detected across all applications.
- Disk Usage - Total disk usage by all detected projects.
- Disk Usage [Delta] - Change in disk usage since previous scan.
- Potentially Recoverable - Estimates the amount of disk space that can potentially be reclaimed by removing duplicates or redundant data.
- Scatter Plot - Visual comparison of applications by project count and size.
- Application Summary Table - Lists all detected applications, including the number of Projects, disk usage, and duplication percentage for each.
Application details view
This view provides an in-depth breakdown of project details for the selected application.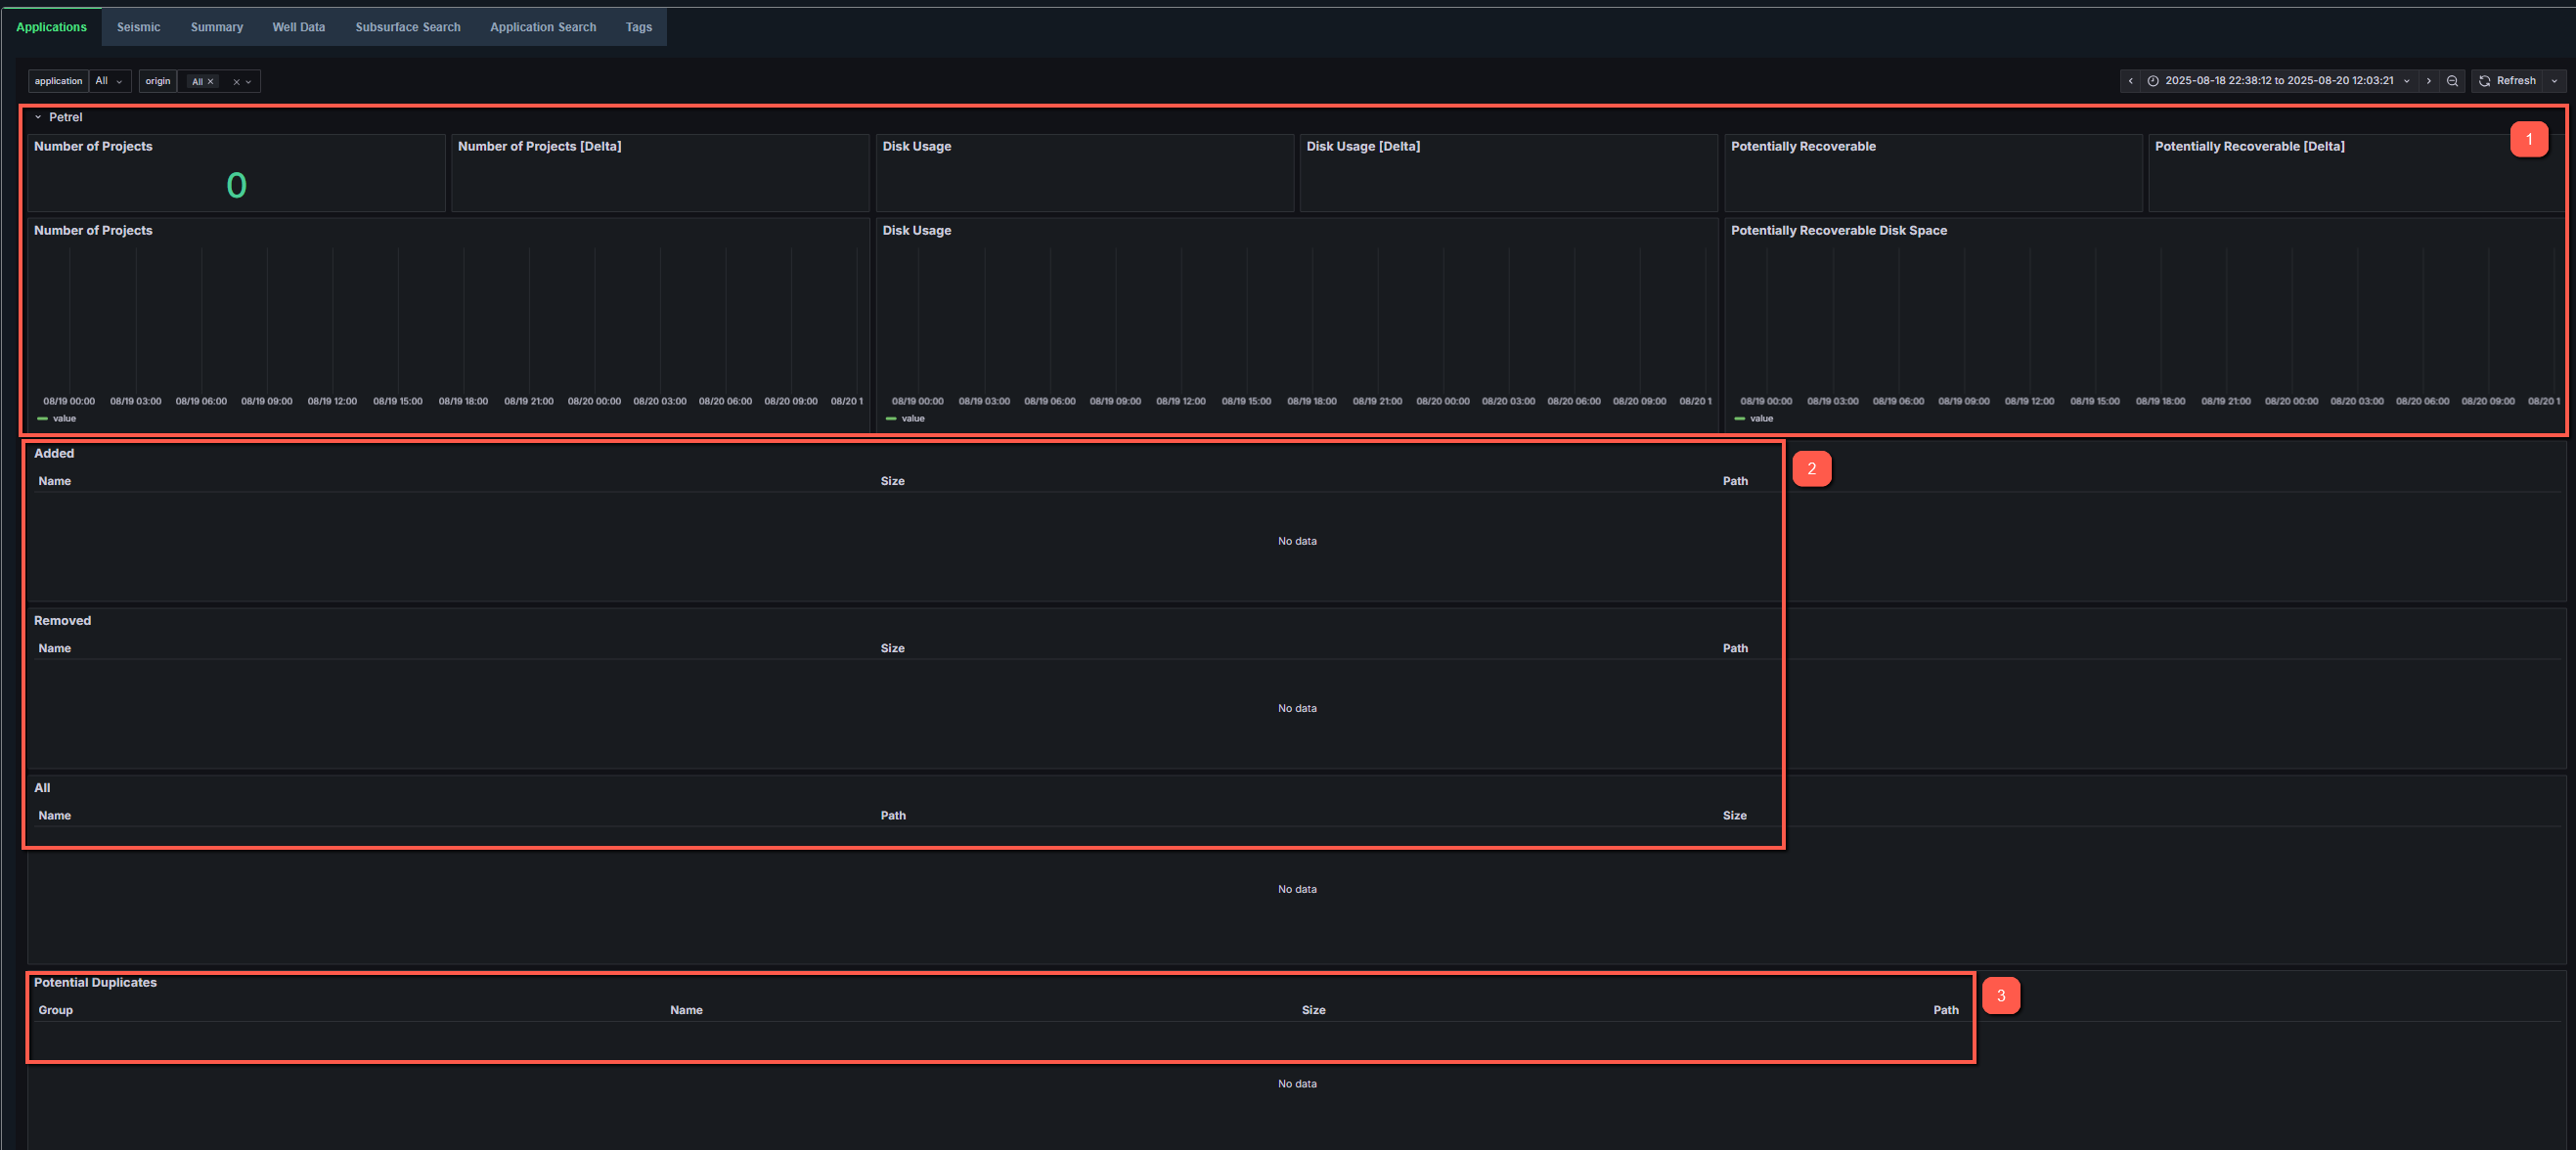
- Metrics displayed
- Number of Projects - Total count of projects detected for the selected application.
- Number of Projects [Delta] - Change in project count since the last crawl.
- Disk Usage - Total storage used by all projects in the application.
- Disk Usage [Delta] - Change in total disk usage since the previous crawl.
- Potentially Recoverable - Estimated amount of storage space that could be recovered by removing duplicate or unused data.
- Potentially Recoverable [Delta] - Change in recoverable space since the last crawl.
Each metric is also represented as a time-series chart, showing trends across multiple crawl periods. This helps users visualize growth or reduction in data usage and project count over time.
- Project lists
- Added - Projects newly detected since the last crawl.
- Removed - Projects that have been deleted or are no longer accessible.
- All - A complete list of all projects associated with the selected application.
Each entry includes:
- Name - The project or data item name.
- Size - The total disk size of the project.
- Path - The directory location where the project resides.
- Duplication lists
- Potential Duplicates - Displays projects with identical or similar data structures, suggesting duplication. Includes file name, size, and path.
Seismic view
The Seismic dashboard shows all seismic files detected in the most recent crawl. It offers insights into file counts, disk usage, data growth trends, and duplication levels, enabling users to monitor storage efficiency and identify potential cleanup opportunities. 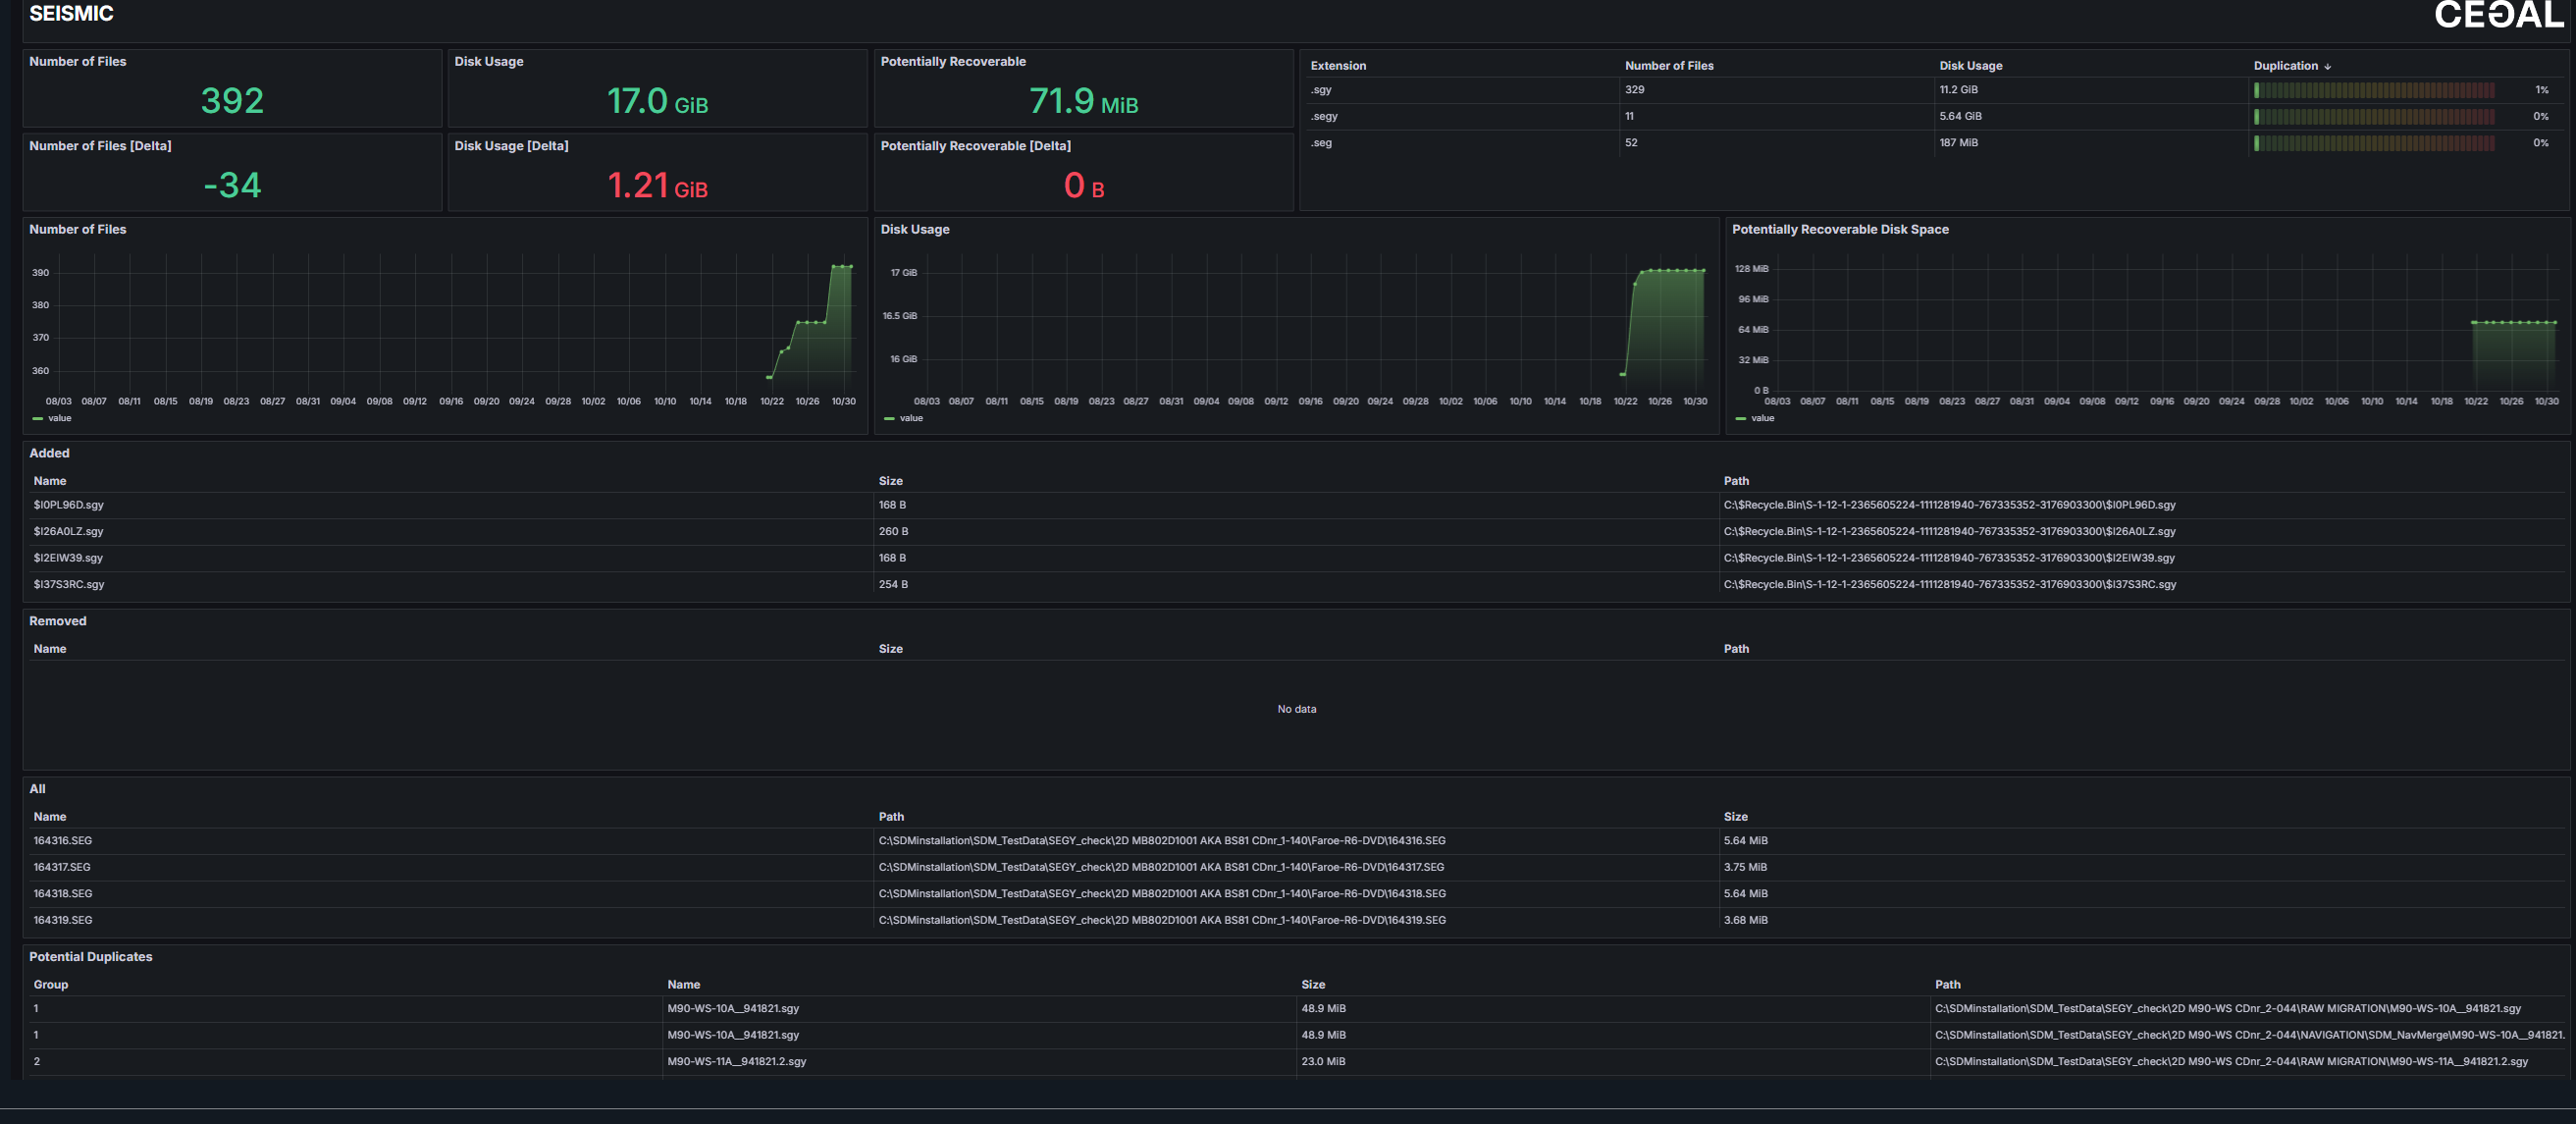
- Metrics displayed
- Number of Files - Total count of seismic files identified in the latest run.
- Number of Files [Delta] - Change in file count since the previous crawl.
- Disk Usage - Total storage occupied by all seismic files.
- Disk Usage [Delta] - Change in total disk usage compared to the last crawl.
- Potentially Recoverable - Estimated amount of storage space that could be reclaimed by removing redundant or duplicate files.
- Potentially Recoverable [Delta] - Change in recoverable space since the previous crawl.
Each metric is visualized through corresponding trend charts, showing how seismic data volume and recoverable space evolve over time.
- File lists
- Added - Seismic files newly detected since the last crawl.
- Removed - Seismic files that have been deleted or are no longer accessible.
- All - A complete list of all seismic files.
Each entry includes:
- Name - The name of the seismic file.
- Size - The total disk size of the seismic file.
- Path - The directory location where the seismic file resides.
- Duplication lists
- Potential Duplicates - Displays files with identical or similar data structures, suggesting duplication. Includes file name, size, and path.
Summary view
The Summary dashboard provides a high-level overview of the crawled file system. It helps users quickly assess total data volume, identify storage efficiency, and monitor long-term trends in data growth and utilization.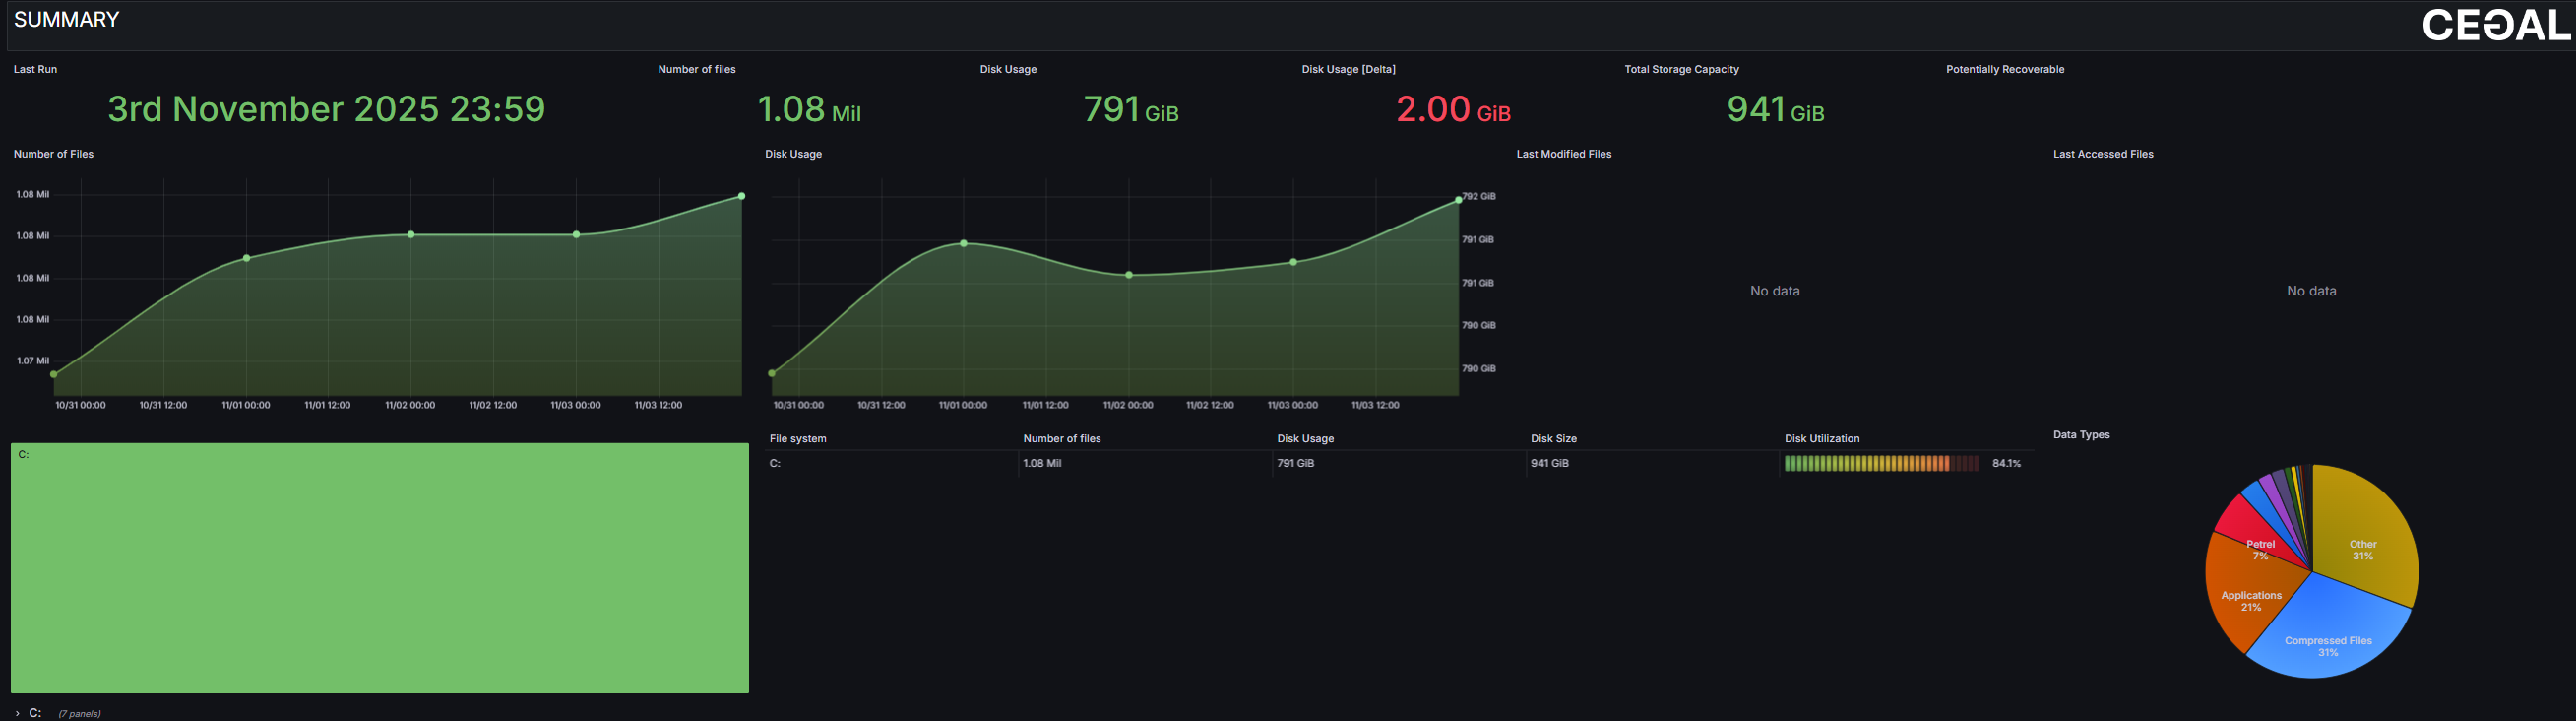
Dashboard components
- Last Run - The timestamp of the most recent crawl.
- Number of Files - Total count of files detected in the system.
- Disk Usage - Total disk space used by all detected files.
- Disk Usage [Delta] - Change in total disk usage compared to the previous run.
- Total Storage Capacity - Combined storage capacity of all crawled drives.
- Potentially Recoverable - Estimated disk space that can potentially be reclaimed by removing duplicate or redundant data.
- Number of Files and Disk Usage Charts - Line charts visualize file count and disk usage over time, allowing users to identify growth trends or sudden increases in data volume.
- File System Summary - Displays each crawled drive with metrics for Number of Files, Disk Usage, Disk Size and Disk Utilization.
- Data Types Pie Chart - Proportional distribution of data categories such as Applications, Compressed Files, Petrel Projects, and Other.
- Last Modified / Last Accessed Files - Recent activity within the file system, helping users identify active or recently changed data.
Drive statistics
Individual drive statistics can be opened for detailed information. Each drive panel shows usage trends, total capacity, and top-level directory distribution. 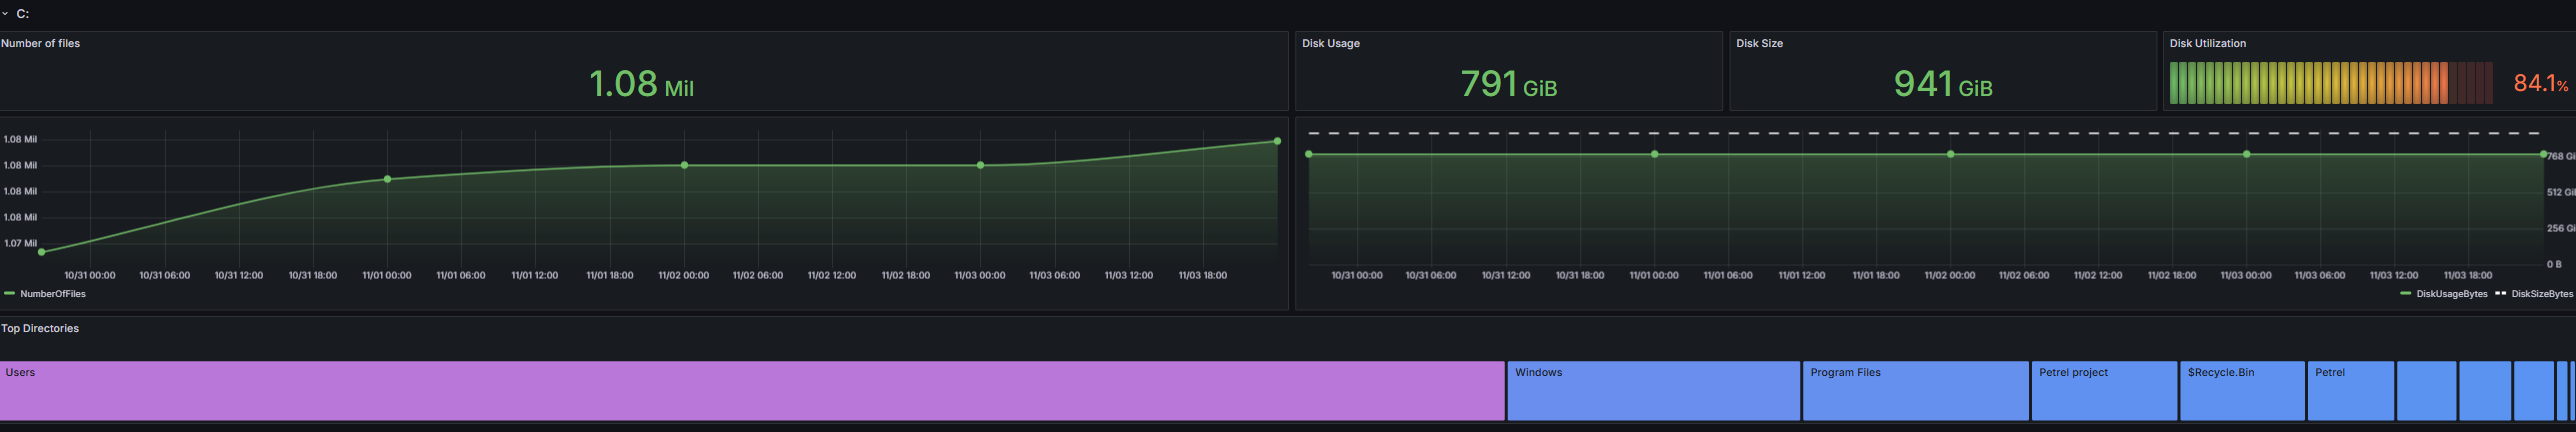
- Number of Files - Total number of files within the selected drive.
- Disk Usage - Total space used by files in the drive.
- Disk Size - Total storage capacity of the drive.
- Disk Utilization - Percentage of used capacity.
- Number of Files Trend Chart - Line chart showing file count changes over time.
- Disk Usage Trend Chart - Line chart displaying changes in total disk usage and size over time.
- Top Directories - Visual representation of major folders within the drive, sized proportionally to their data volume (e.g., Users, Windows, Program Files, Petrel Project).
Well Data view
The Well Data dashboard shows all well-related files detected in the most recent run. It helps users monitor the number of well data files, track changes in storage usage, and identify duplicate or redundant files that can be optimized to free up disk space.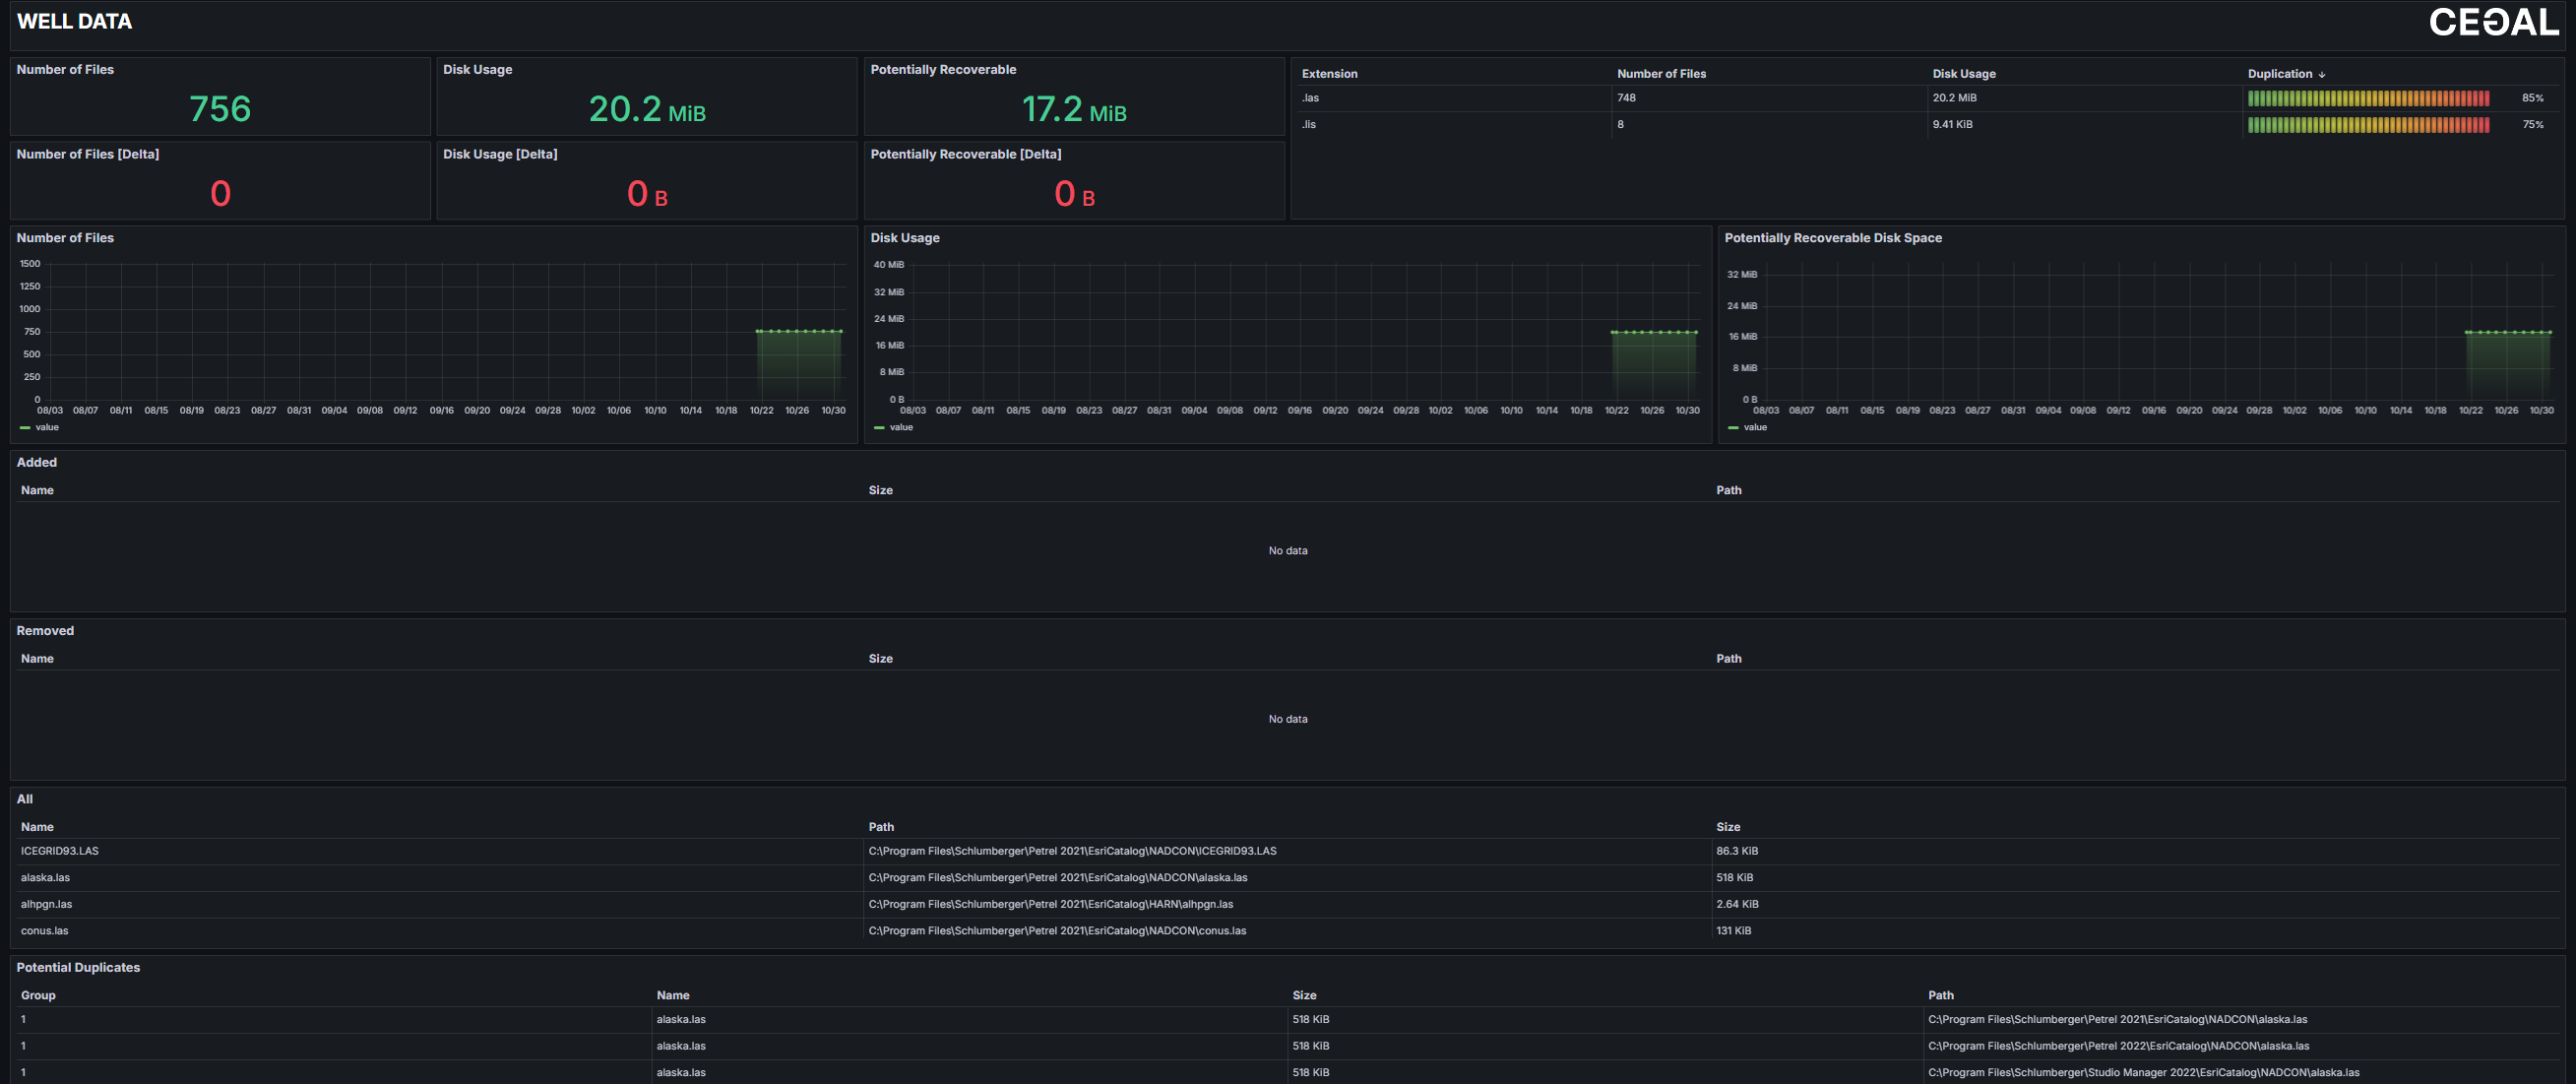
- Metrics displayed
- Number of Files - Total count of well data files identified in the latest crawl.
- Number of Files [Delta] - Change in file count since the previous crawl.
- Disk Usage - Total storage occupied by all well data files.
- Disk Usage [Delta] - Change in disk usage compared to the last crawl.
- Potentially Recoverable - Estimated amount of storage space that could be reclaimed by removing redundant or duplicate files.
- Potentially Recoverable [Delta] - Change in recoverable space since the previous crawl.
Each metric is visualized through corresponding trend charts, showing how well data volume and recoverable space evolve over time.
- File lists
- Added - Well data files newly detected since the last crawl.
- Removed - Well data files that have been deleted or are no longer accessible.
- All - A complete list of all well data files.
Each entry includes:
- Name - The name of the well data file.
- Size - The total disk size of the file.
- Path - The directory location where the files resides.
- Duplication lists Potential Duplicates - Displays files with identical or similar data structures, suggesting duplication. Includes file name, size, and path.
Subsurface Search view
The Subsurface Search table allows users to locate and review subsurface-related files (seismic or well data) within the system. It provides flexible filtering, detailed file metadata, and tagging capabilities to support efficient data discovery, classification, and management.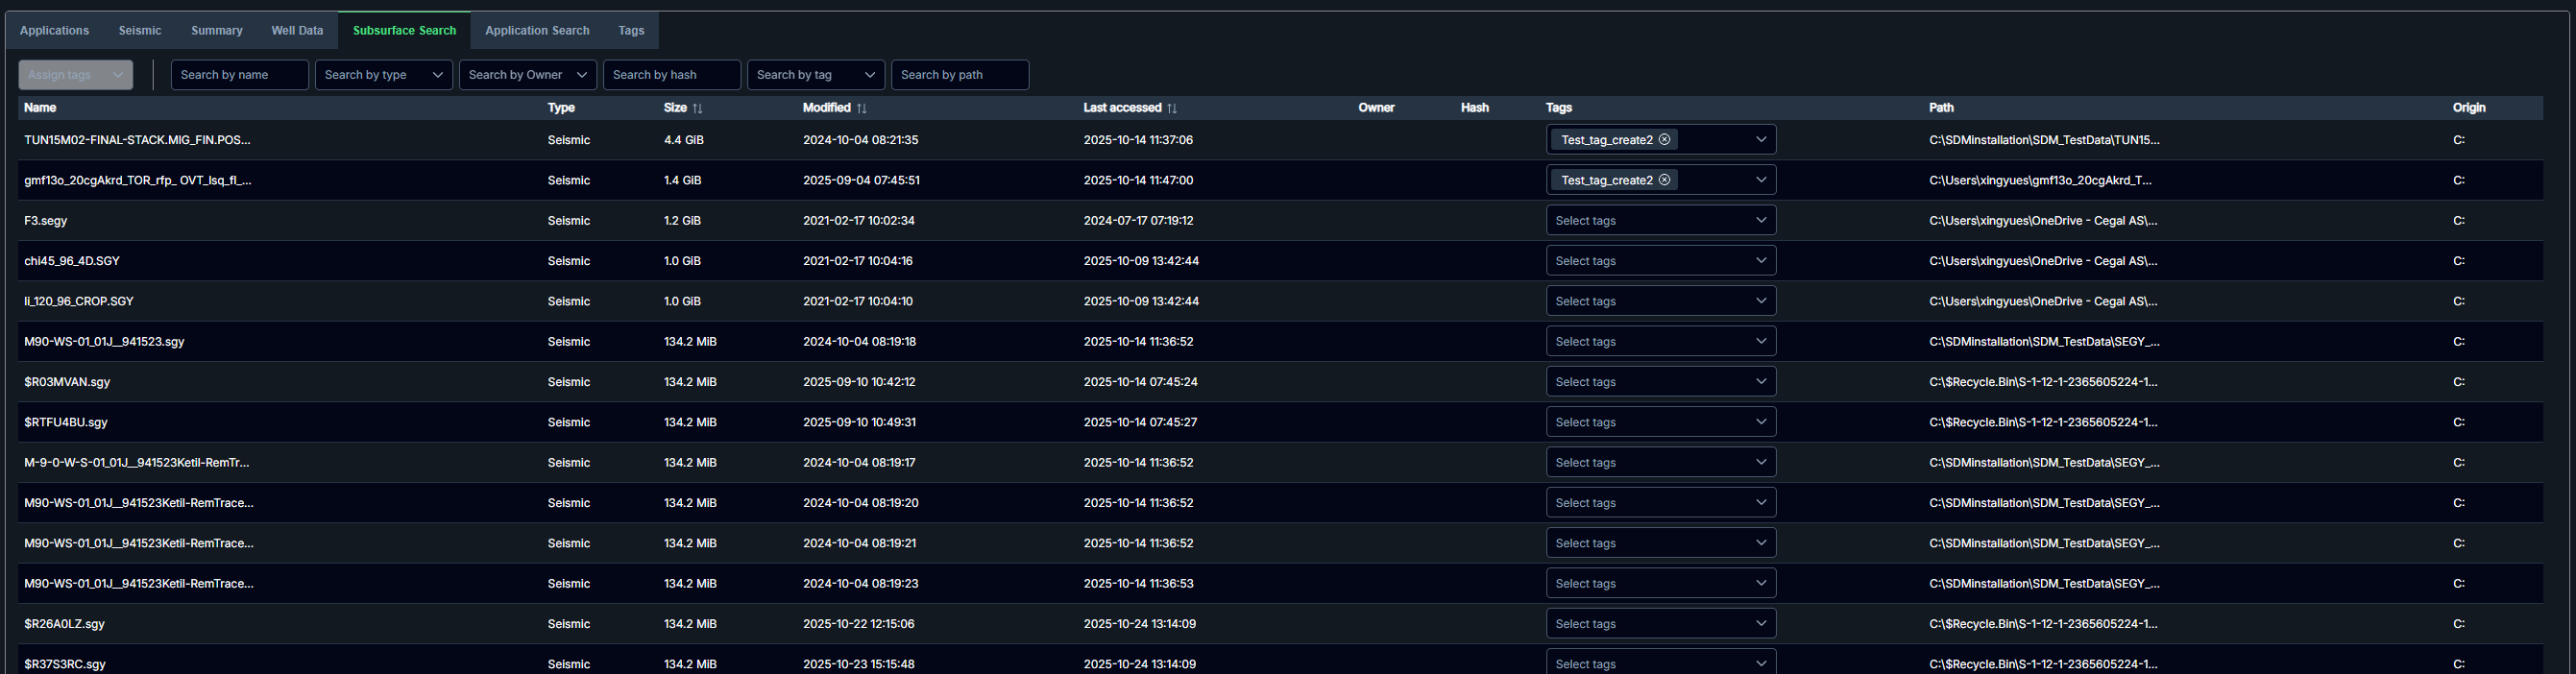
Table columns
Each file entry in the results table includes the following metadata fields:
- Name - The file name.
- Type - The data category (e.g., Seismic).
- Size - The total size of the file.
- Modified - Date and time of the last modification.
- Last Accessed - Date and time the file was last opened or read.
- Owner - The user associated with the file.
- Hash - A unique identifier used to detect duplicate files.
- Tags - Allows users to assign or manage tags directly from the table for better classification.
- Path - The file's directory location in the system.
- Origin - The originating drive or storage location.
Sorting can be applied to Size, Modified and Last accessed column, helping users quickly identify the largest or most recently updated files.
Search and Filter Options
At the top of the table, several search tools are available to narrow results:
- Search by Name - Locate files by full or partial file name.
- Search by Type - Filter by data type (e.g., Seismic or Well data).
- Search by Owner - Display files owned or created by a specific user.
- Search by Hash - Identify identical files using their unique hash values.
- Search by Tag - Filter files that have specific tags assigned.
- Search by Path - Locate files within a defined directory or file path.
Users can combine multiple filters to refine results and focus on specific datasets.
Application Search view
The Application Search table allows users to explore and manage application-related projects, such as Petrel datasets. It provides detailed project information, filtering and tagging options, and helps users locate large or duplicate projects across the storage environment. 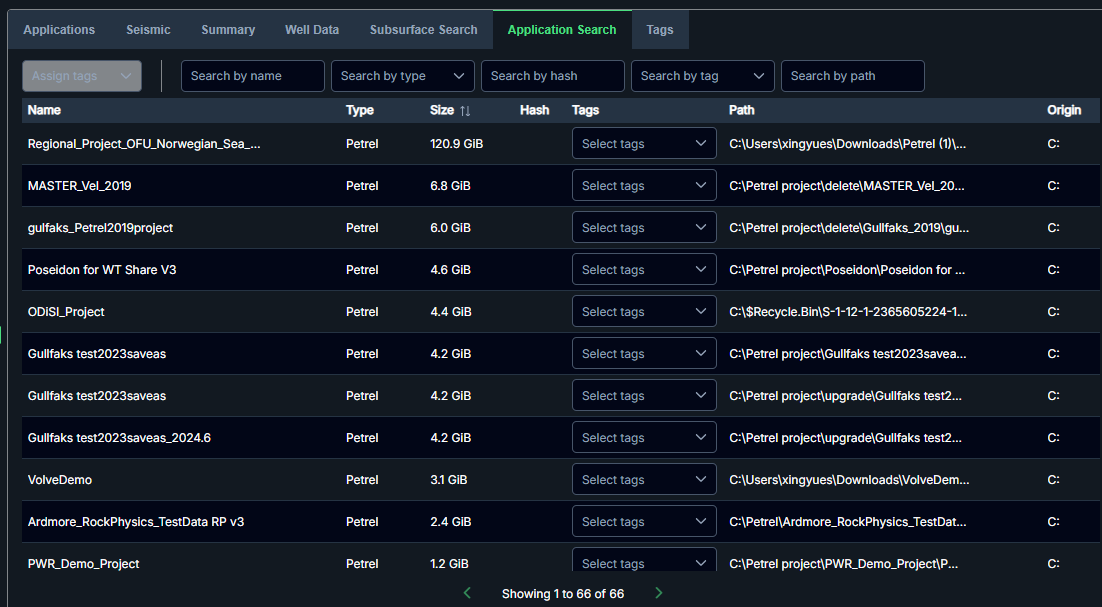
Table columns
Each file entry in the results table includes key metadata fields:
- Name - The project name.
- Type - The application type (e.g., Petrel).
- Size - The total disk size of the project.
- Hash - A unique digital identifier used to detect duplicates.
- Tags - Add or remove tags for easier classification.
- Path - The file system path showing the exact project location.
- Origin - The originating drive or storage location.
Sorting can be applied to Size column, allowing users to quickly identify the largest projects.
Search and Filter Options
At the top of the table, several search tools are available to narrow results:
- Search by Name - Find projects by full or partial project name.
- Search by Type - Filter by application type (e.g., Petrel, Prosper, MBAL).
- Search by Hash - Identify duplicate or identical projects by hash values.
- Search by Tag - Display only projects associated with specific tags.
- Search by Path - Limit results to a particular directory or file path.
Users can combine multiple filters to refine results and focus on specific datasets.
Tags view
The Tags view provides a centralized interface for managing all tags used across the datasets.
Tags are used to categorize, organize, and quickly locate files and projects within different data domains (e.g.,Seismic, Well Data, or Applications).
Search
Use the search bar for locating existing tags quickly. 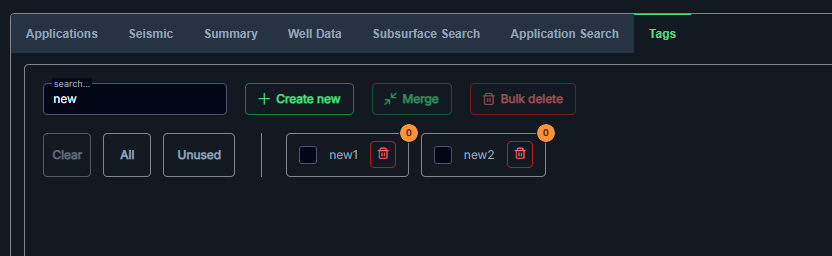
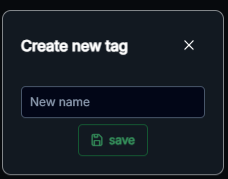
Create new
Click  to open the tag creation dialog. Enter a tag name and select Save to add it to the list.
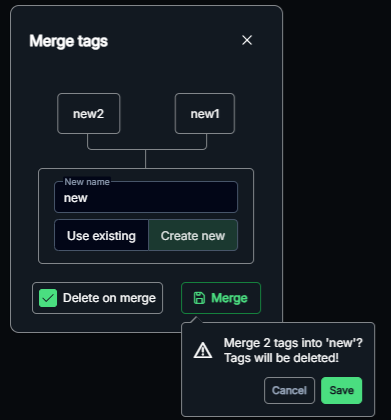
Merge
Combines multiple selected tags into one to reduce duplicates and maintain consistent naming. Users can merge selected tags into a newly created tag or merge them into an existing tag.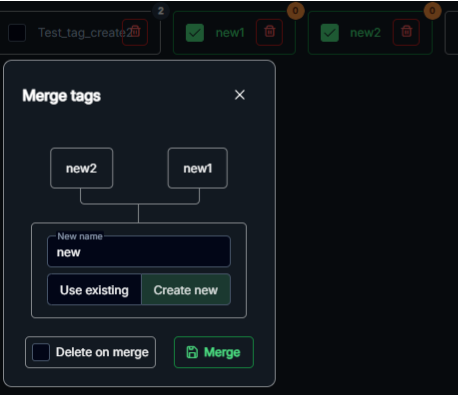
If the  option is selected, previous tags will be deleted after merging.
Below is the newly created tag after merging. The previous tags were removed. 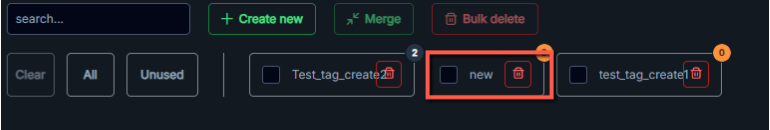
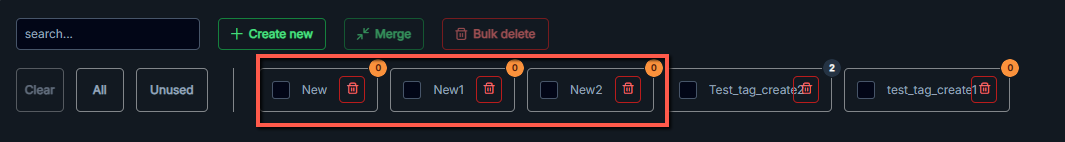
If the option is unselected, both the new tag and previous tags remain visible.
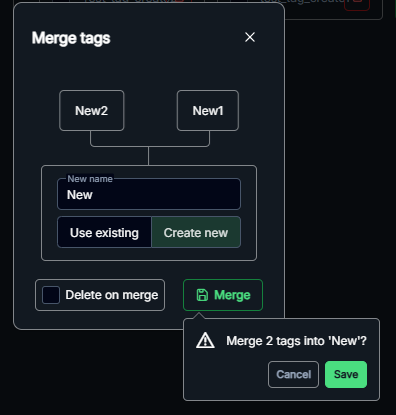
A dropdown list is available for merging into an existing tag. 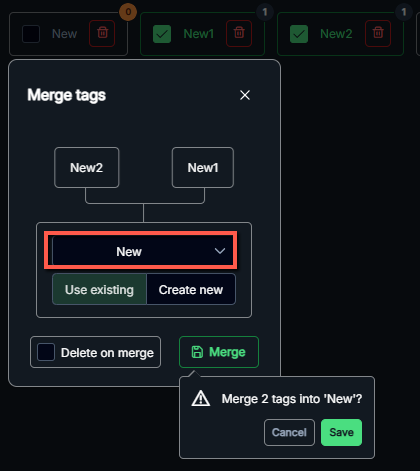
Bulk delete
Removes selected tags and unassigns them from all associated data items. 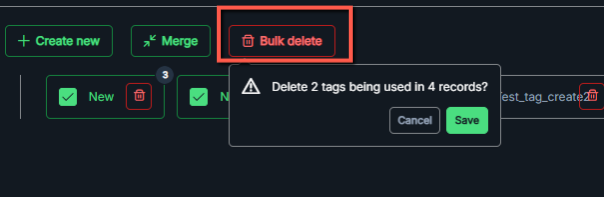
Clear/All/Unused
Clear - Clears all tag selections.

All - Selects all available tags.

Unused - Selects all tags not currently assigned to any items.

Tag list
Each tag entry includes:
- Tag name
- Usage count - Number of files or projects associated with that tag.
- Delete - Permanently removes the tag.

Tags updated or deleted here automatically update across all table views, including Subsurface Search and Application Search tables.