Core Reporting
A Core Report is a scheduled, repeating scan of a data landscape. It builds on a Pre-Assessment and adds dashboards, searchable tables, and trend analysis so you can monitor how your data estate changes over time.
At a glance
- Pick a schedule: Daily, Weekly, Bi-Weekly, Monthly, or custom Cron
- Four dashboards: Summary, Applications, Seismic, Well Data
- Two search tables: Subsurface Data, Application Data
- Centralized Tags view to organize files and projects
- Each metric is shown alongside its delta vs. the previous run, plus a trend chart
1. Configure a schedule
Setting up a Core Report follows on from completing a Pre-Assessment and clicking Start monitoring. You'll land on the schedule configuration page:
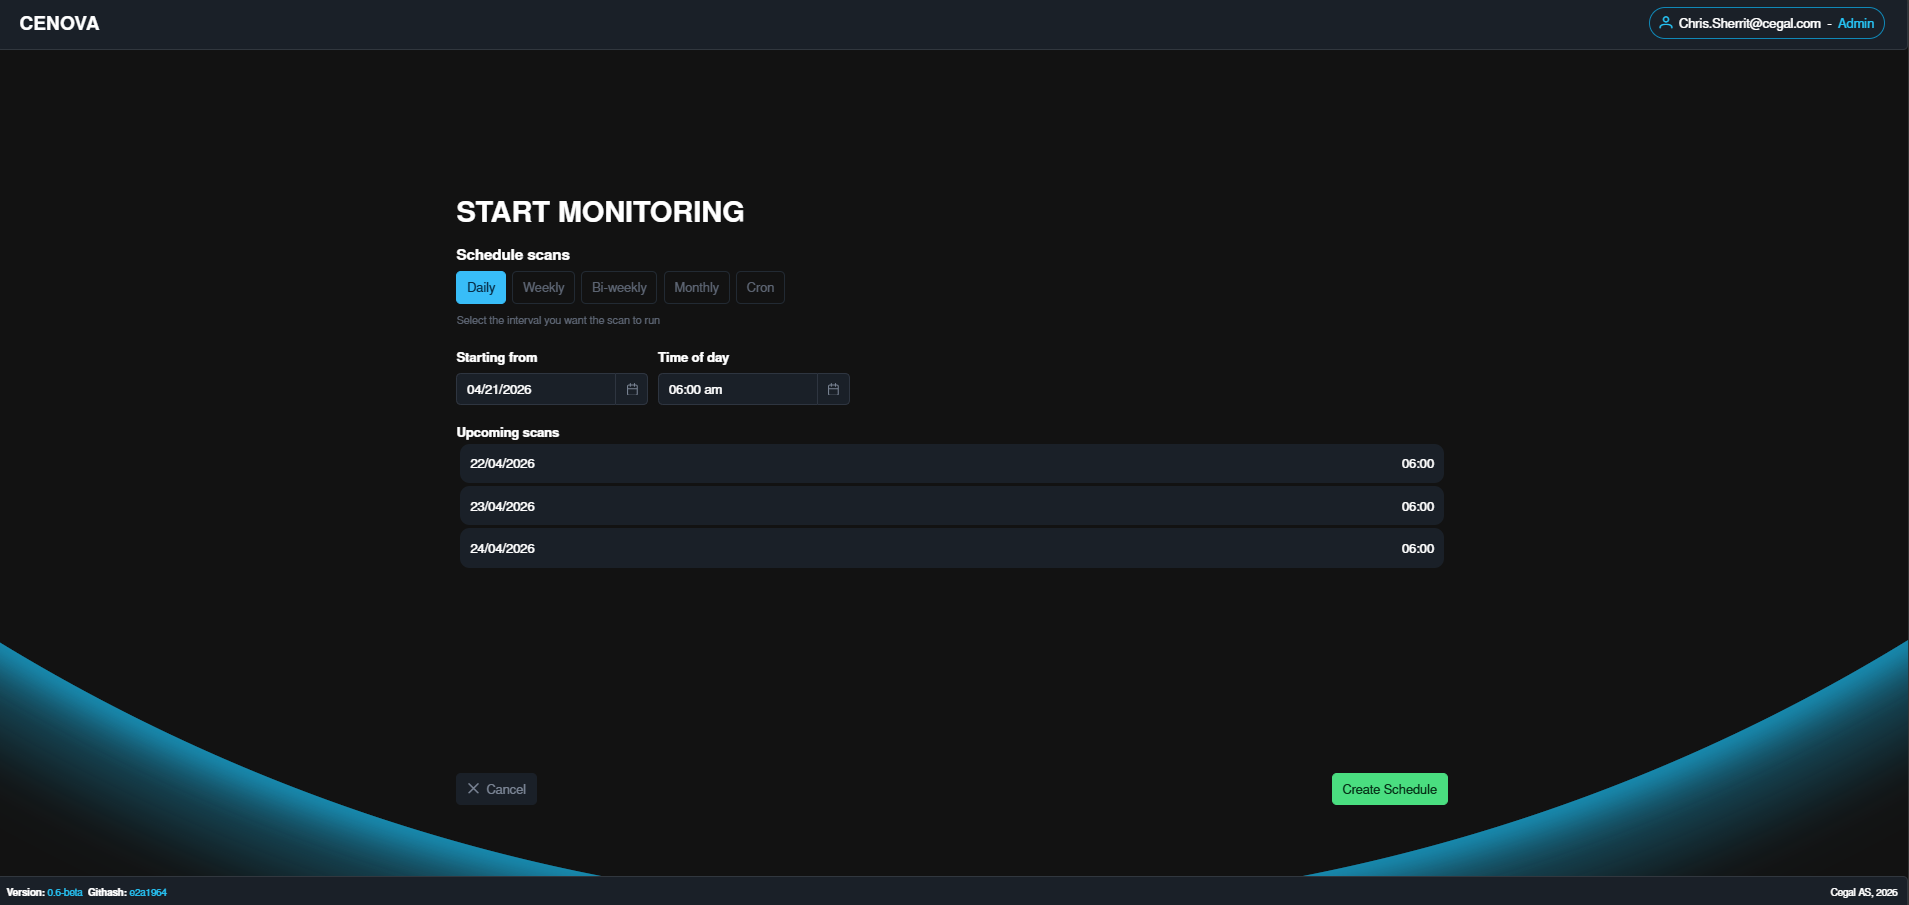
Choose how often the scan should run:
| Schedule | What you set |
|---|---|
| Daily | Start date + time of day |
| Weekly | Start date, time of day, day of the week |
| Bi-Weekly | Start date, time of day, days of the week |
| Monthly | Start date, time of day, day of the month |
| Cron | A custom schedule using a cron expression |
TIP
What is a cron expression?
A cron expression is a compact string that defines a recurring schedule. It's made up of five fields, separated by spaces, that represent — in order — the minute, hour, day of the month, month, and day of the week on which a job should run.
┌───────────── minute        (0–59)
│ ┌───────────── hour        (0–23)
│ │ ┌───────────── day of month (1–31)
│ │ │ ┌───────────── month   (1–12)
│ │ │ │ ┌───────────── day of week (0–6, Sunday = 0)
│ │ │ │ │
* * * * *
An asterisk (*) means "every" value for that field. A few examples:
| Expression | Meaning |
|---|---|
0 6 * * * | Every day at 06:00 |
30 2 * * 1 | Every Monday at 02:30 |
0 0 1 * * | At midnight on the 1st of every month |
0 */4 * * * | Every 4 hours, on the hour |
Use the Cron option when the built-in schedules don't fit your needs — for example, running a scan only on weekdays or several times a day. If you're unsure how to write one, tools like crontab.guru can help you build and validate expressions.
Once scheduled, the Core Report runs in the background. While a scan is in progress:
A blue ribbon appears at the top of the Pre-Assessment / report view.
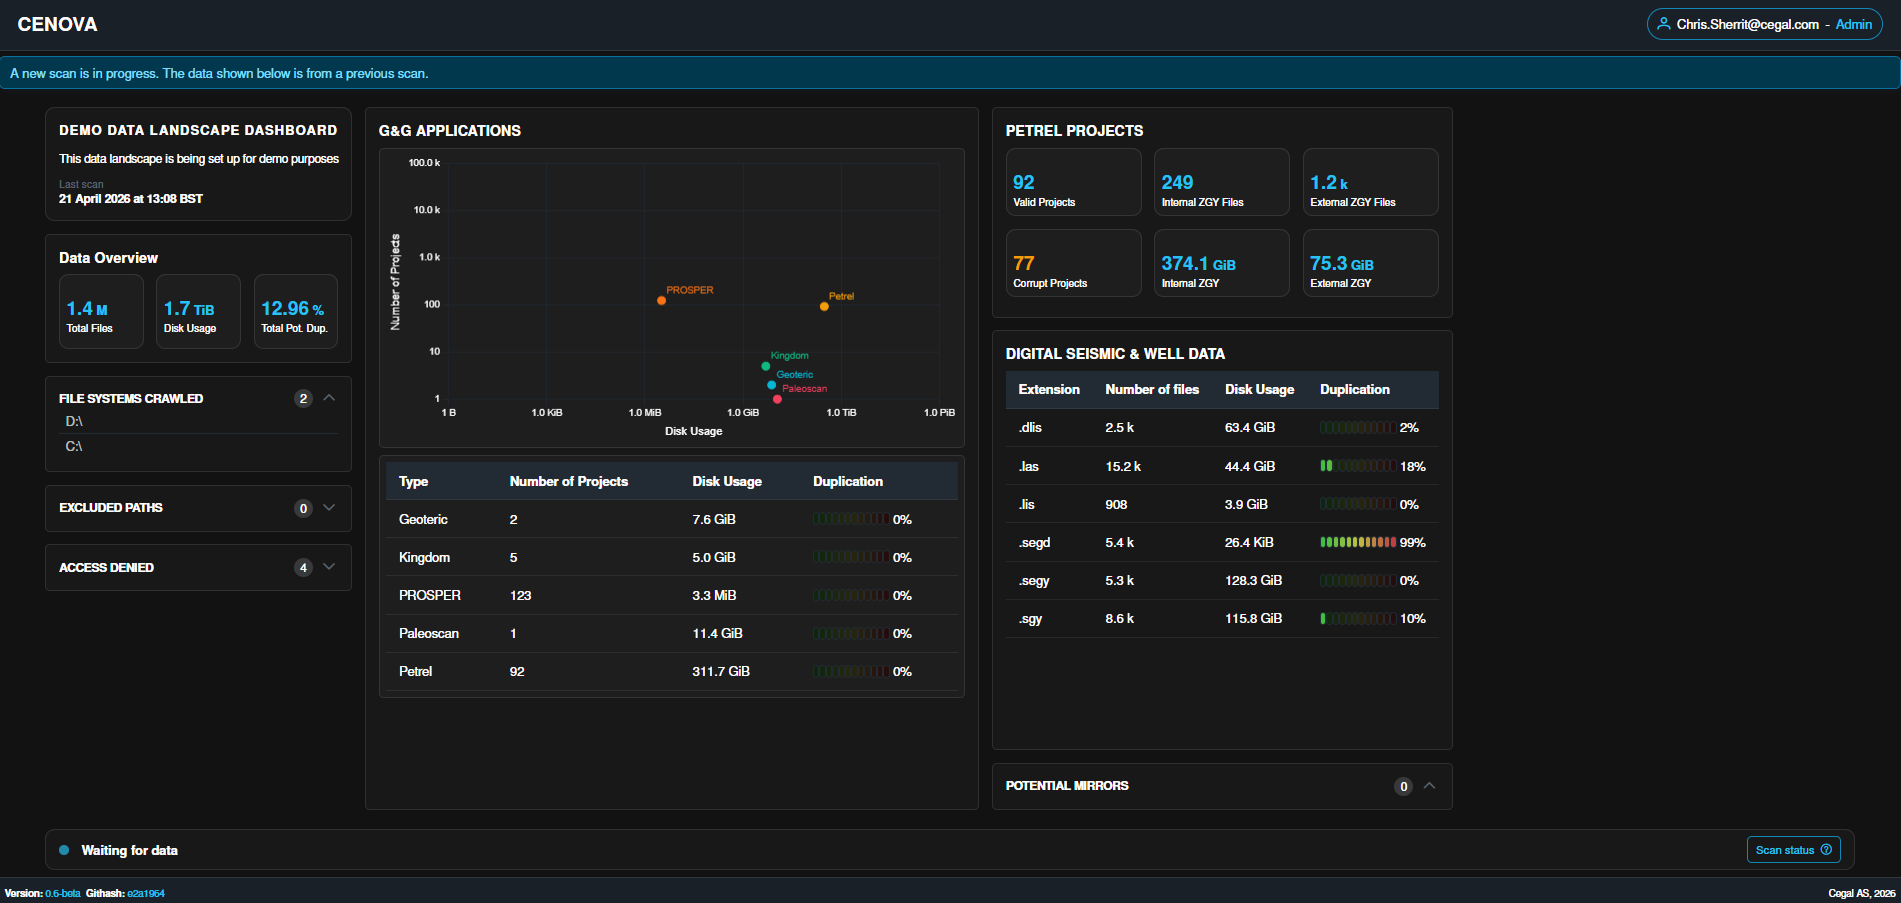
A status bar at the bottom of the page lets you click Scan Status for a detailed view.
NOTE
Whenever a new scan starts you'll see the blue ribbon at the top and the status ribbon at the bottom. Click Scan Status to drill into progress.
Run or stop a scan manually
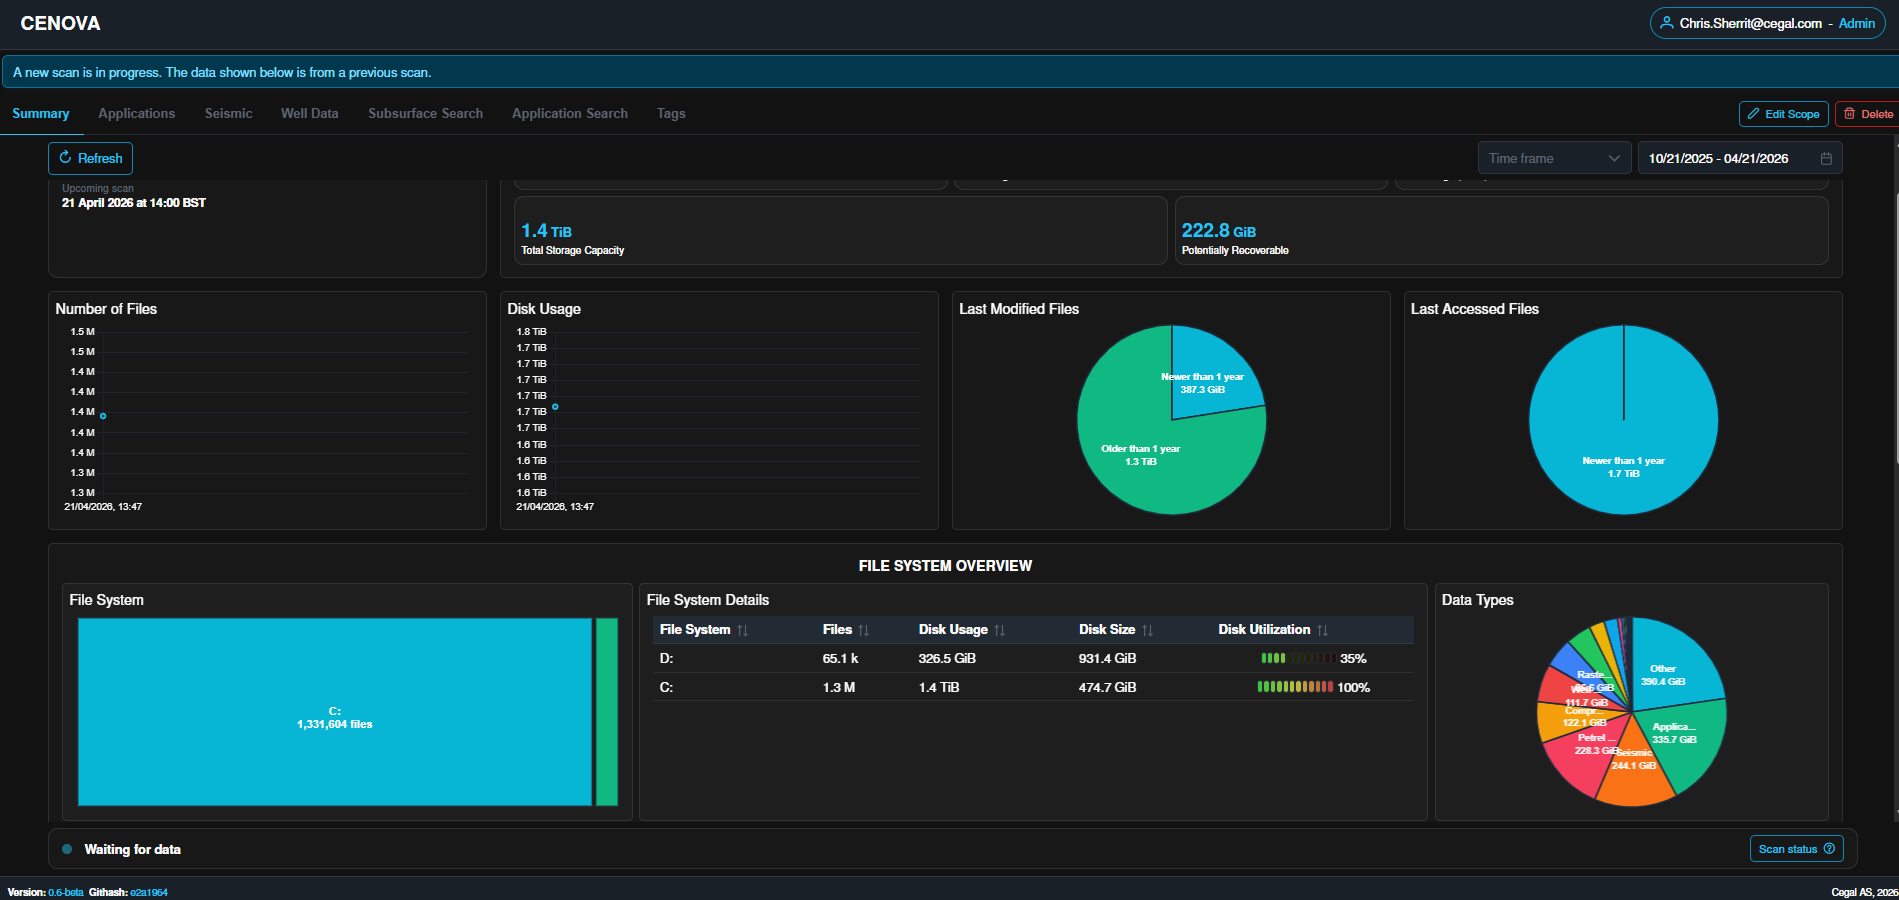
You don't have to wait for the next scheduled run. Alongside the configured schedule, Cenova lets you control scans on demand:
- Run now — trigger a scan immediately, without changing the configured schedule. This is useful when you've just added data or want up-to-date results ahead of the next scheduled run.
- Stop — cancel a scan that is currently in progress. The scan halts safely and the report continues to reflect the last completed run.
Manually triggered scans behave exactly like scheduled ones — the same blue ribbon and status bar appear while they run, and the schedule you configured stays in place for future automatic runs.
2. Results overview
Results are presented through dashboards and tables.
| Dashboards | Tables | Tags |
|---|---|---|
| Summary, Applications, Seismic, Well Data | Subsurface Data, Application Data | Centralized tag management |
3. Summary dashboard
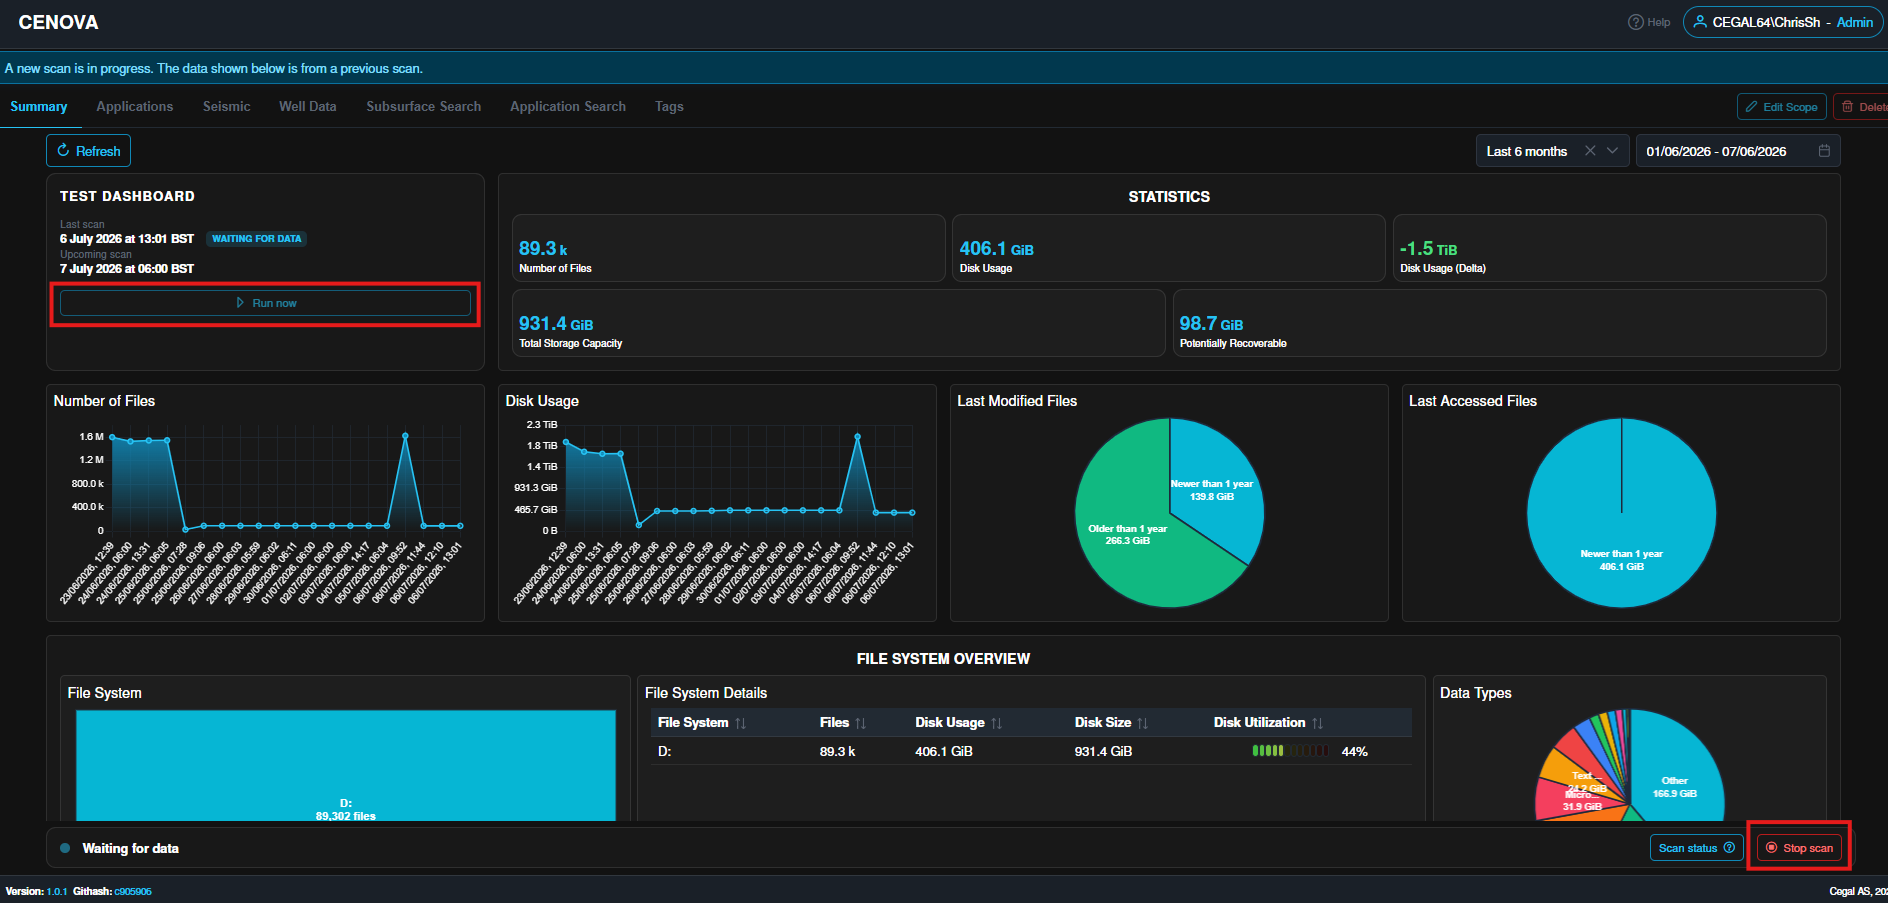
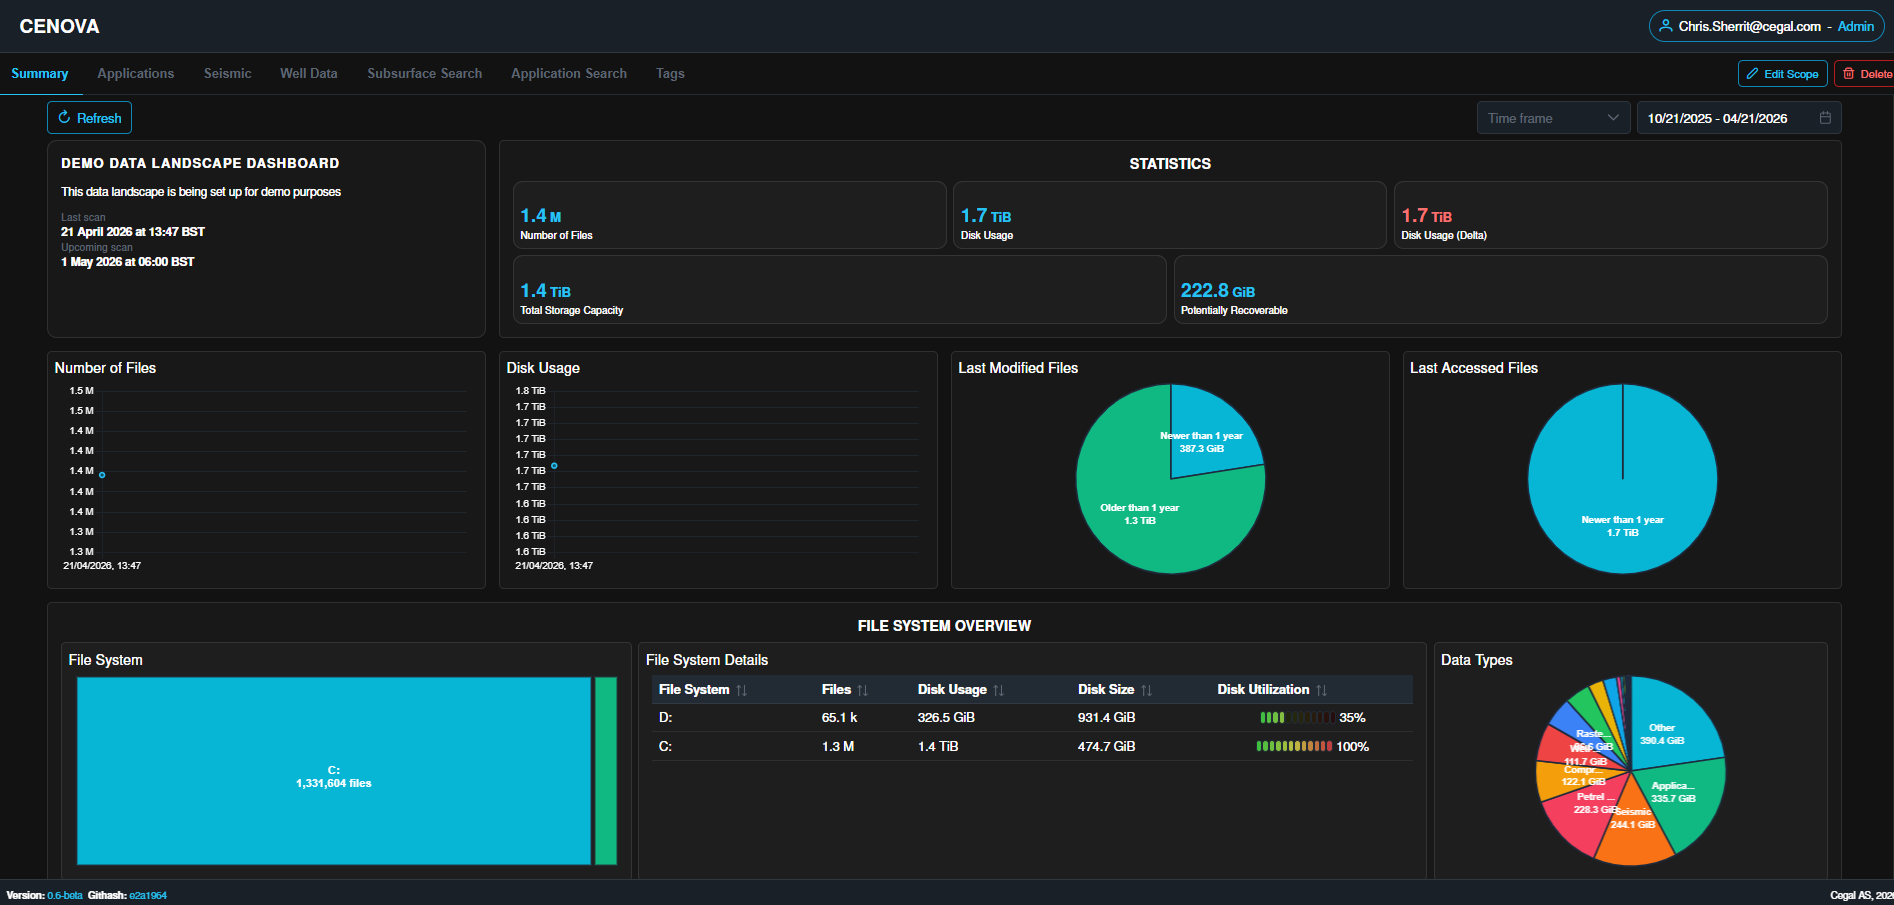
A high-level overview of the indexed file system — total volume, storage efficiency, and long-term trends.

Components
| Component | Description |
|---|---|
| Last Scan | Timestamp of the most recent scan. |
| Number of Files | Total file count. |
| Disk Usage | Total space used. |
| Disk Usage [Delta] | Change vs. previous run. |
| Total Storage Capacity | Combined capacity across indexed drives. |
| Potentially Recoverable | Estimated space reclaimable by removing duplicates / redundant data. |
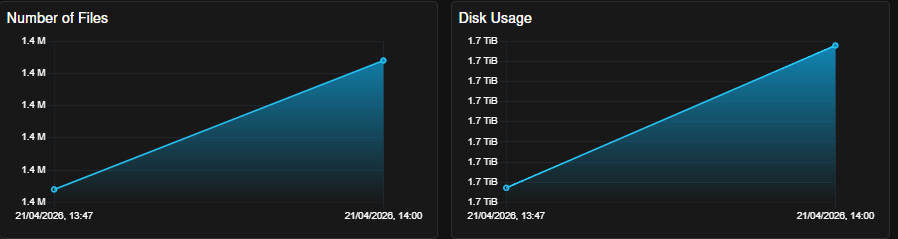
| Files & Disk Usage charts | Time-series of file count and disk usage. |
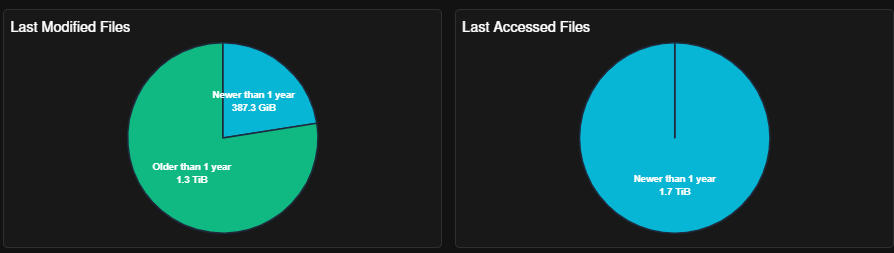
| Last Modified / Accessed pies | Recent activity within the file system. |
| File System Summary | Per-drive: file count, disk usage, size, utilization. |
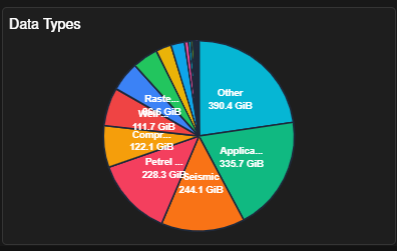
| Data Types pie | Distribution across categories (Applications, Compressed, Petrel Projects, Other). |
Drive statistics
Open an individual drive panel for usage trends, capacity, and a breakdown of top-level directories.
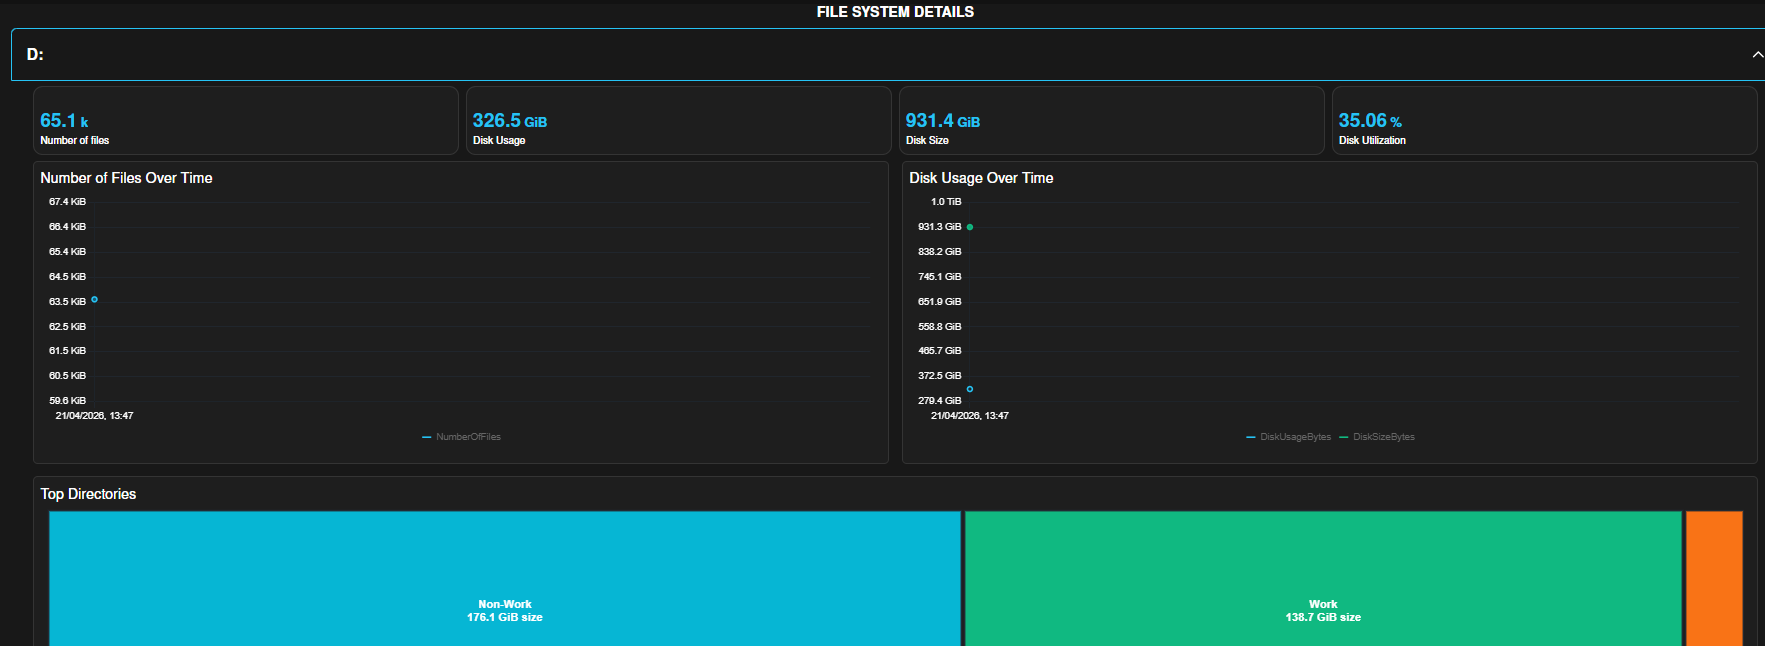
| Component | Description |
|---|---|
| Number of Files | Total files on this drive. |
| Disk Usage | Total used by files on this drive. |
| Disk Size | Total drive capacity. |
| Disk Utilization | Percentage of capacity used. |
| Number of Files trend | File count over time. |
| Disk Usage trend | Disk usage and size over time. |
| Top Directories | Major folders, sized proportionally to data volume. |
The Summary view also charts how your data has changed over time, with optional drill-downs by fileshare, drive, or folder.
It also shows last access / modification activity (newer than vs. older than 1 year):
…and high-level data attribution:
4. Applications dashboard
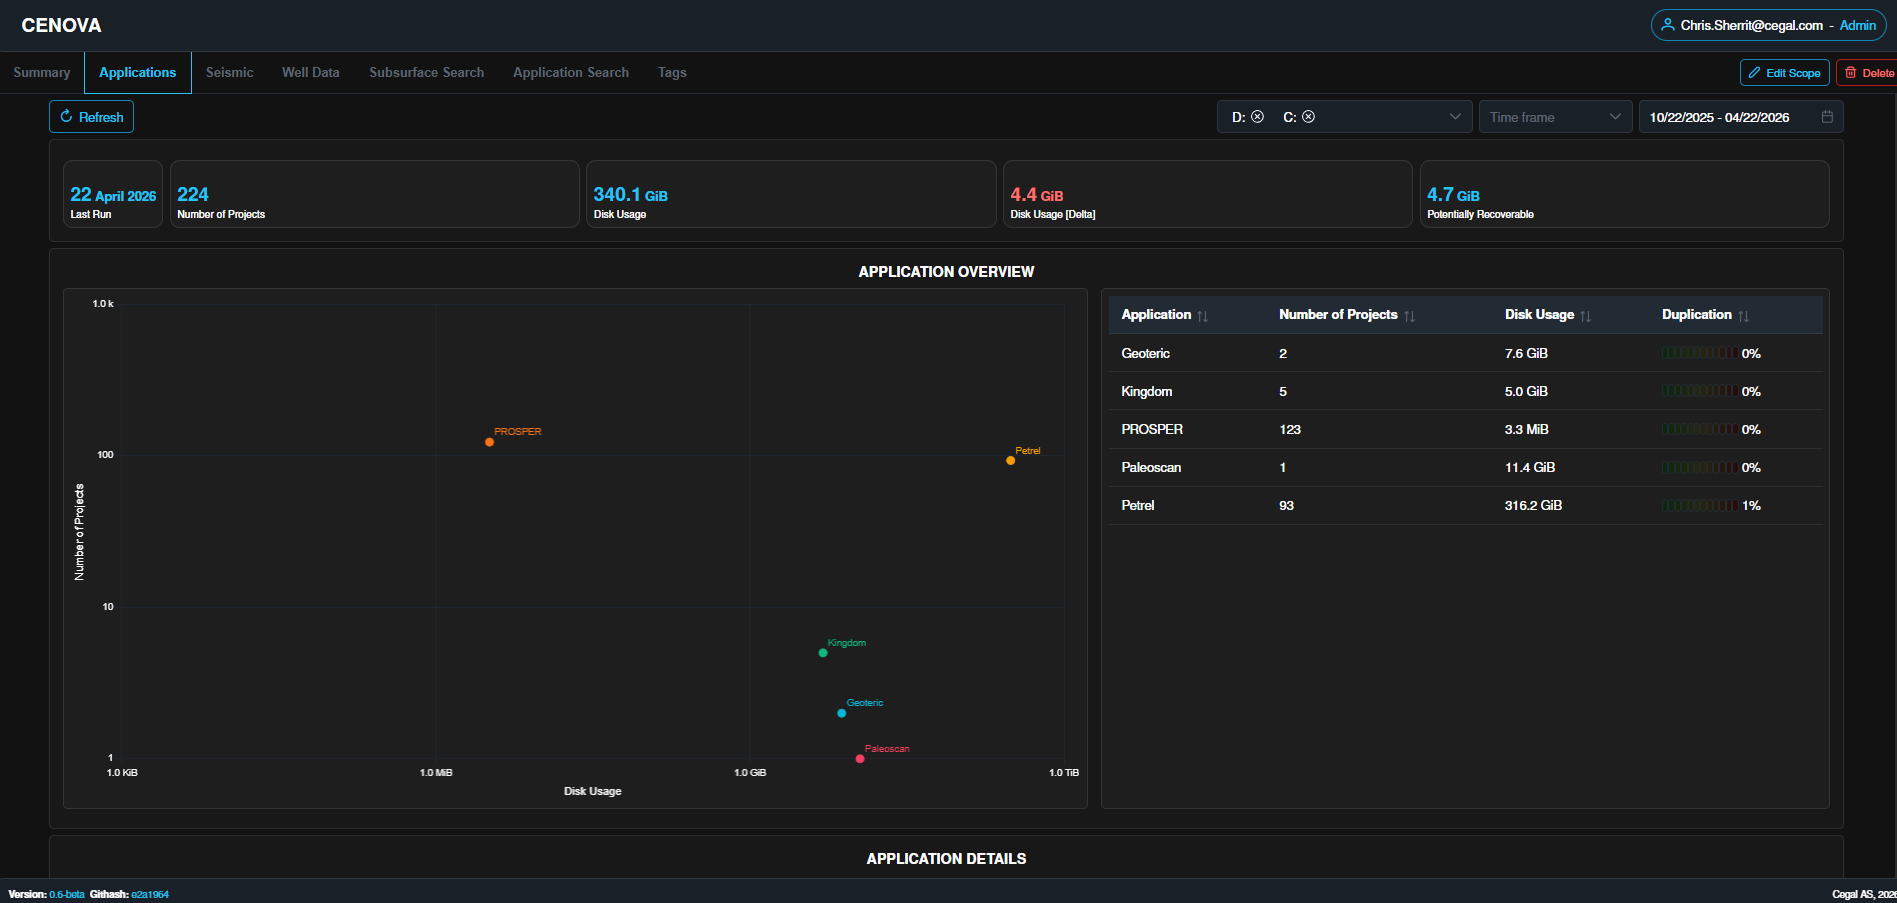
An overview of all detected application projects — counts, disk usage, recoverable space, and duplication.
Metrics
| Metric | Description |
|---|---|
| Last Run | Timestamp of the last scan. |
| Number of Projects | Total projects across all applications. |
| Disk Usage | Total used by all projects. |
| Disk Usage [Delta] | Change since previous scan. |
| Potentially Recoverable | Reclaimable space estimate. |
| Scatter Plot | Apps compared by project count and size. |
| Application Summary Table | Per-app projects, disk usage, duplication %. |
Application details view
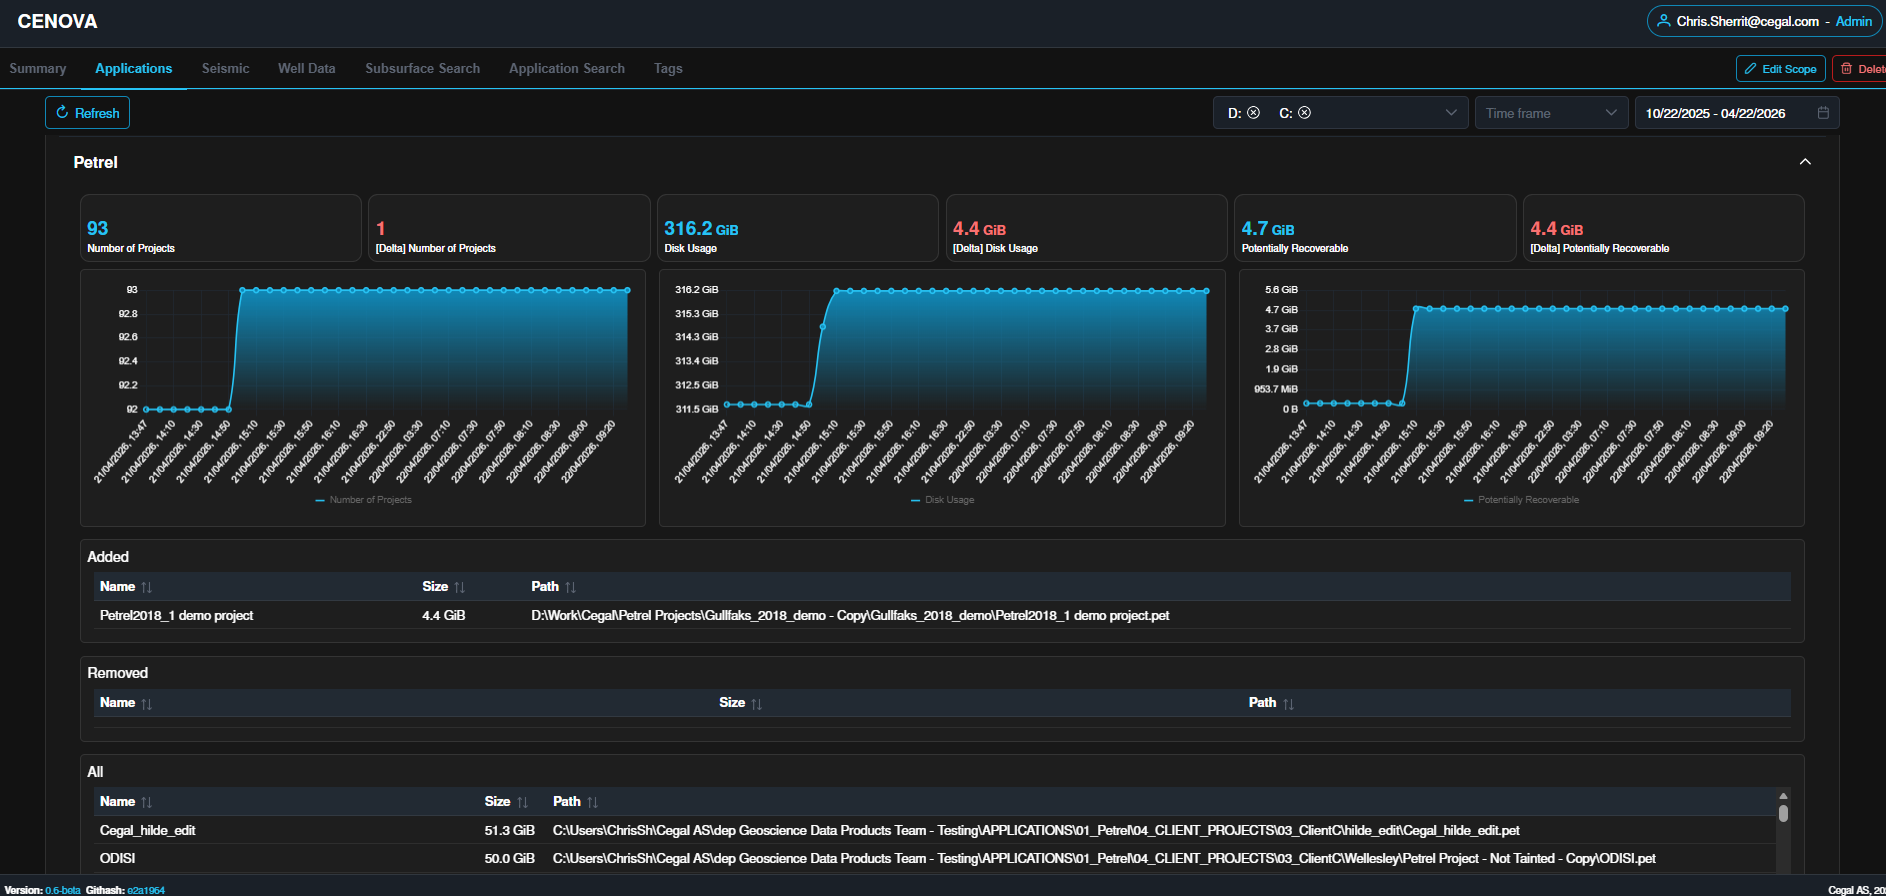
Drill into a single application for a deeper breakdown.
4.1 Metrics (with deltas and trend charts)
| Metric | Description |
|---|---|
| Number of Projects | Total projects detected for this app. |
| Number of Projects [Delta] | Change since the last scan. |
| Disk Usage | Total storage used. |
| Disk Usage [Delta] | Change since the last scan. |
| Potentially Recoverable | Reclaimable space estimate. |
| Potentially Recoverable [Delta] | Change in recoverable space. |
Each metric is also charted over time so you can see growth or reduction across multiple scans.
4.2 Project lists
| List | Description |
|---|---|
| Added | Projects newly detected since the last scan. |
| Removed | Projects deleted or no longer accessible. |
| All | Every project for this application. |
Each entry shows: Name, Size, Path.
4.3 Duplication
- Potential Duplicates — projects with identical or similar structures, with name, size, and path.
5. Seismic dashboard
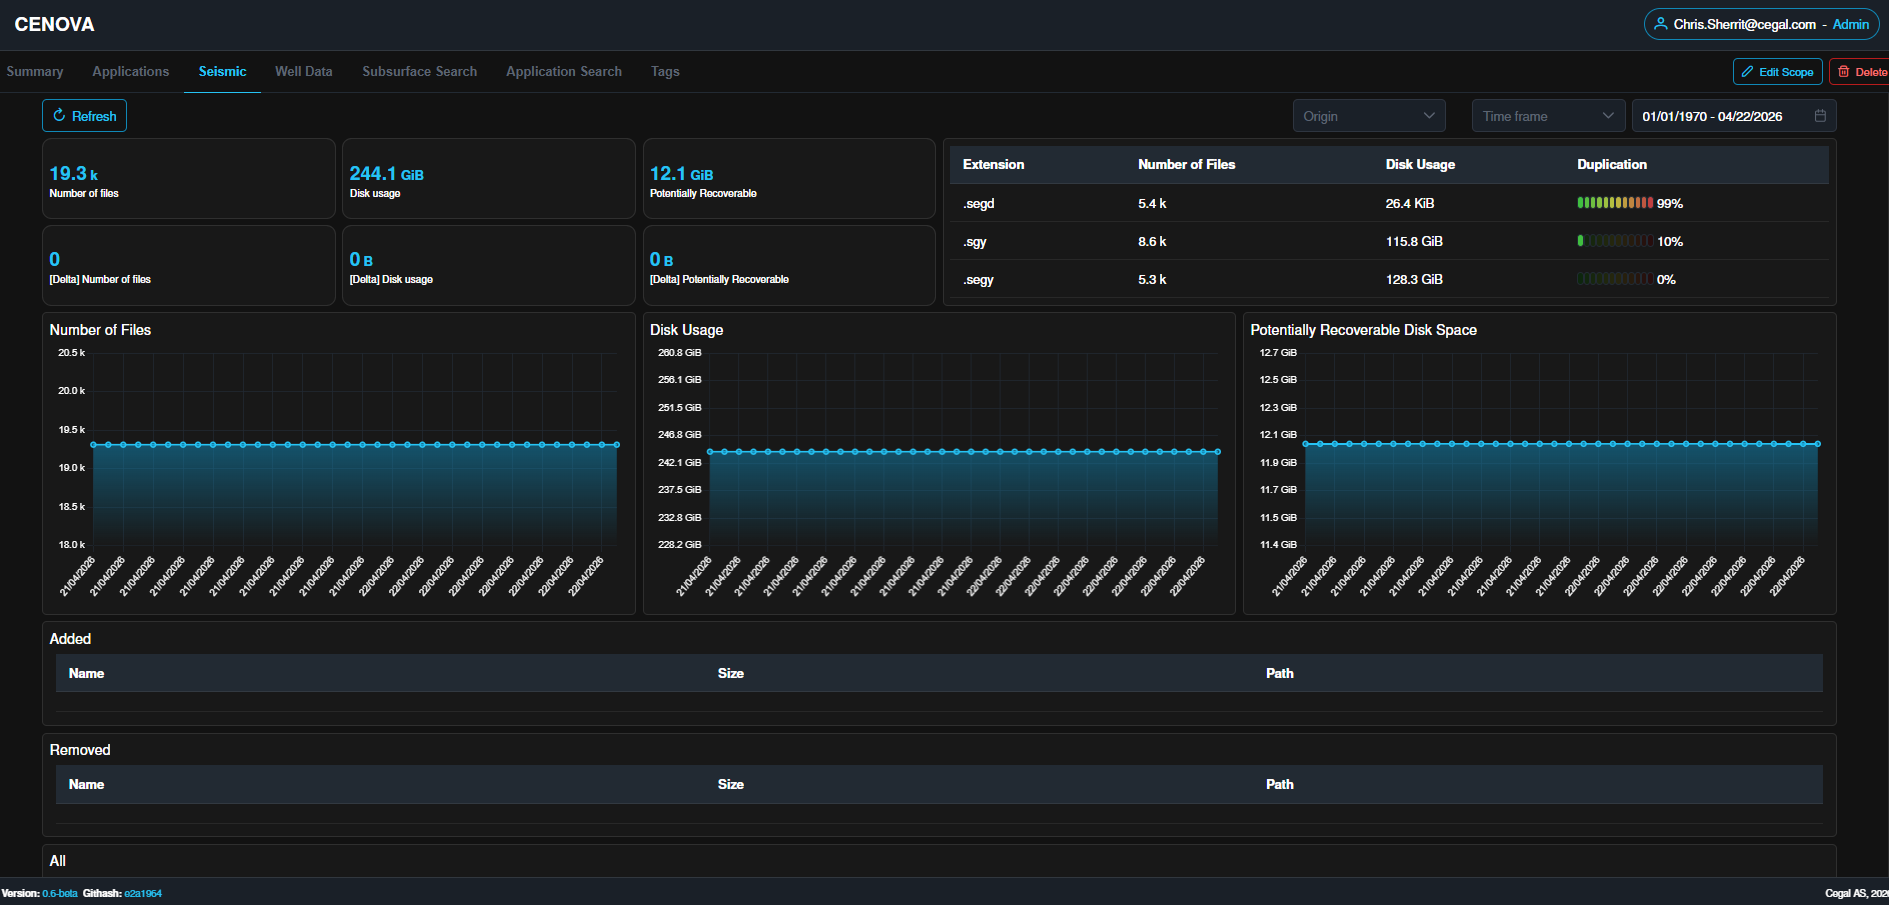
All seismic files detected in the most recent scan, with file counts, disk usage, growth trends, and duplication.
Metrics
| Metric | Description |
|---|---|
| Number of Files | Seismic files in the latest run. |
| Number of Files [Delta] | Change since the previous scan. |
| Disk Usage | Total used by seismic files. |
| Disk Usage [Delta] | Change since the previous scan. |
| Potentially Recoverable | Reclaimable space estimate. |
| Potentially Recoverable [Delta] | Change in recoverable space. |
Each metric is paired with a trend chart.
File lists
| List | Description |
|---|---|
| Added | New seismic files since the last scan. |
| Removed | Seismic files deleted or no longer accessible. |
| All | Every seismic file. |
Each entry shows: Name, Size, Path.
Potential Duplication
- Potential Duplicates — files with identical or similar structures, with name, size, and path.
6. Well Data dashboard
All well-related files detected in the most recent scan, with the same metric / list / duplication structure as the Seismic view.
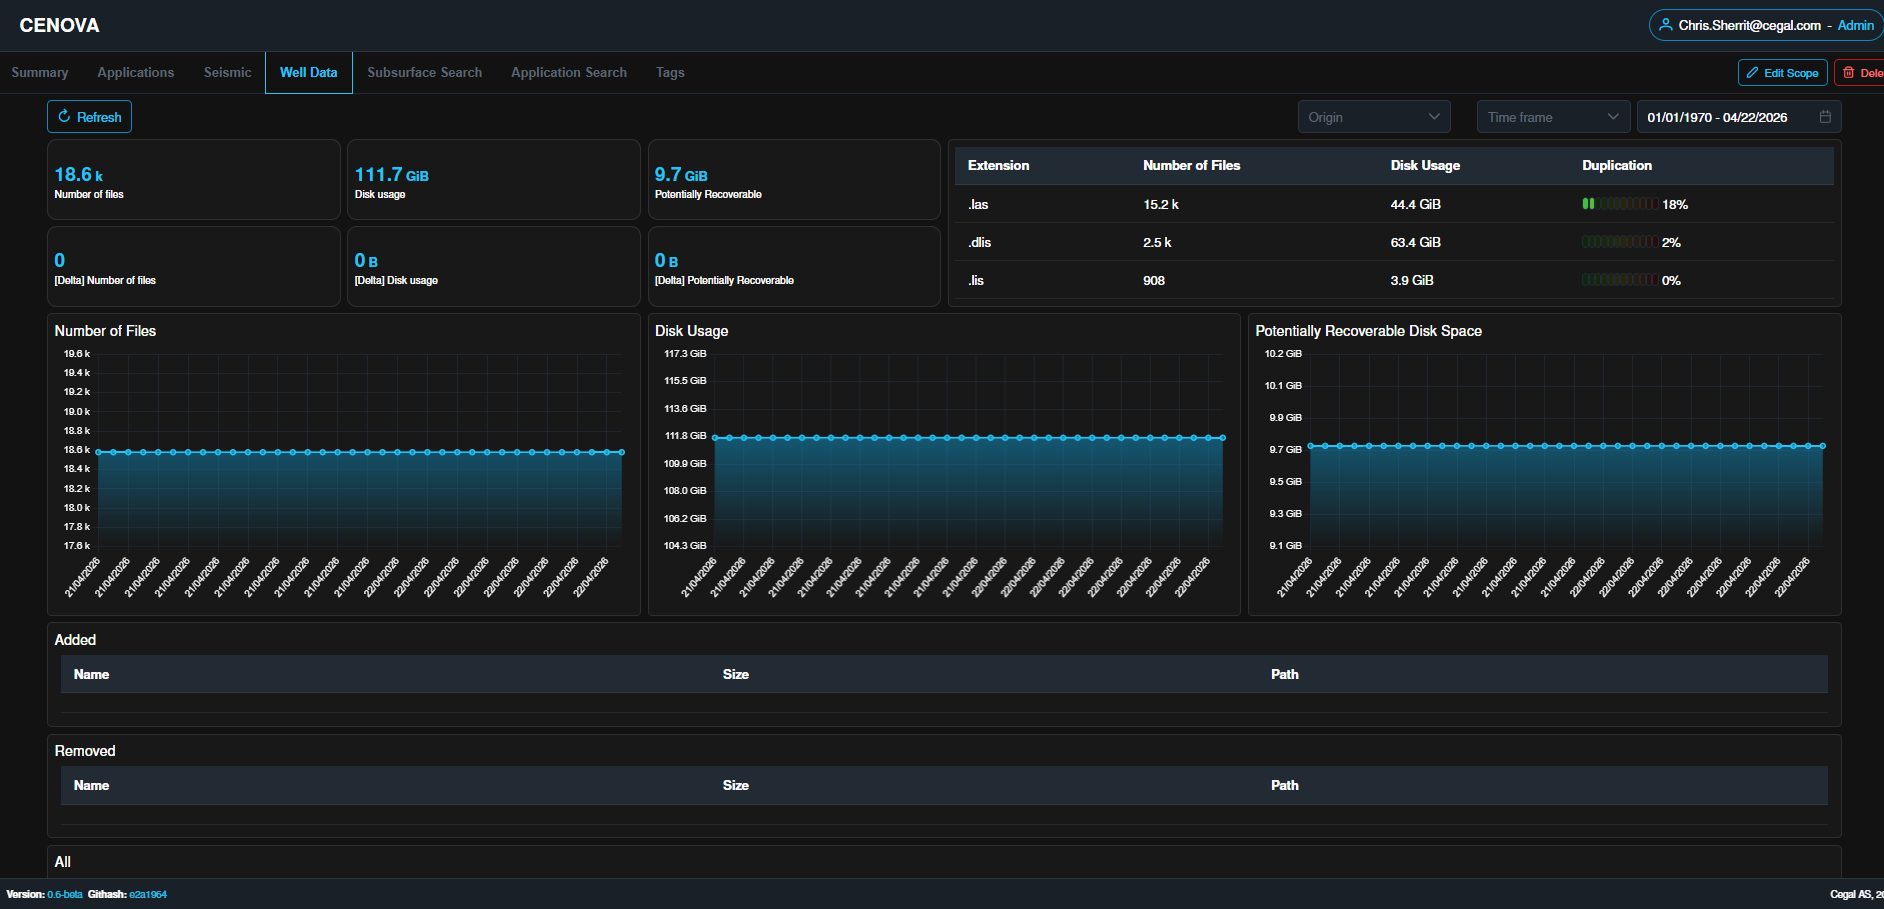
Metrics
| Metric | Description |
|---|---|
| Number of Files | Well data files in the latest scan. |
| Number of Files [Delta] | Change since the previous scan. |
| Disk Usage | Total used by well data files. |
| Disk Usage [Delta] | Change since the previous scan. |
| Potentially Recoverable | Reclaimable space estimate. |
| Potentially Recoverable [Delta] | Change in recoverable space. |
File lists
| List | Description |
|---|---|
| Added | New well files since the last scan. |
| Removed | Well files deleted or no longer accessible. |
| All | Every well file. |
Each entry shows: Name, Size, Path.
Potential Duplication
- Potential Duplicates — files with identical or similar structures, with name, size, and path.
7. Data Hygiene
Data Hygiene is Cenova's safe, governed way to act on the Potential Duplicates that the Seismic and Well Data dashboards surface. Indexing tells you what is duplicated; Data Hygiene gives your team a controlled path to actually reclaim that space — without anyone deleting subsurface data on a whim.
The workflow follows the same shape for both Seismic and Well data:
- Review duplicate groups on the dashboard.
- Verify the contents of a group with a byte-level MD5 comparison.
- Stage the specific files within a group that should go.
- Submit the deletion as a request.
- An Admin approves or denies the request, with a final modification check.
- Approved deletions are carried out.
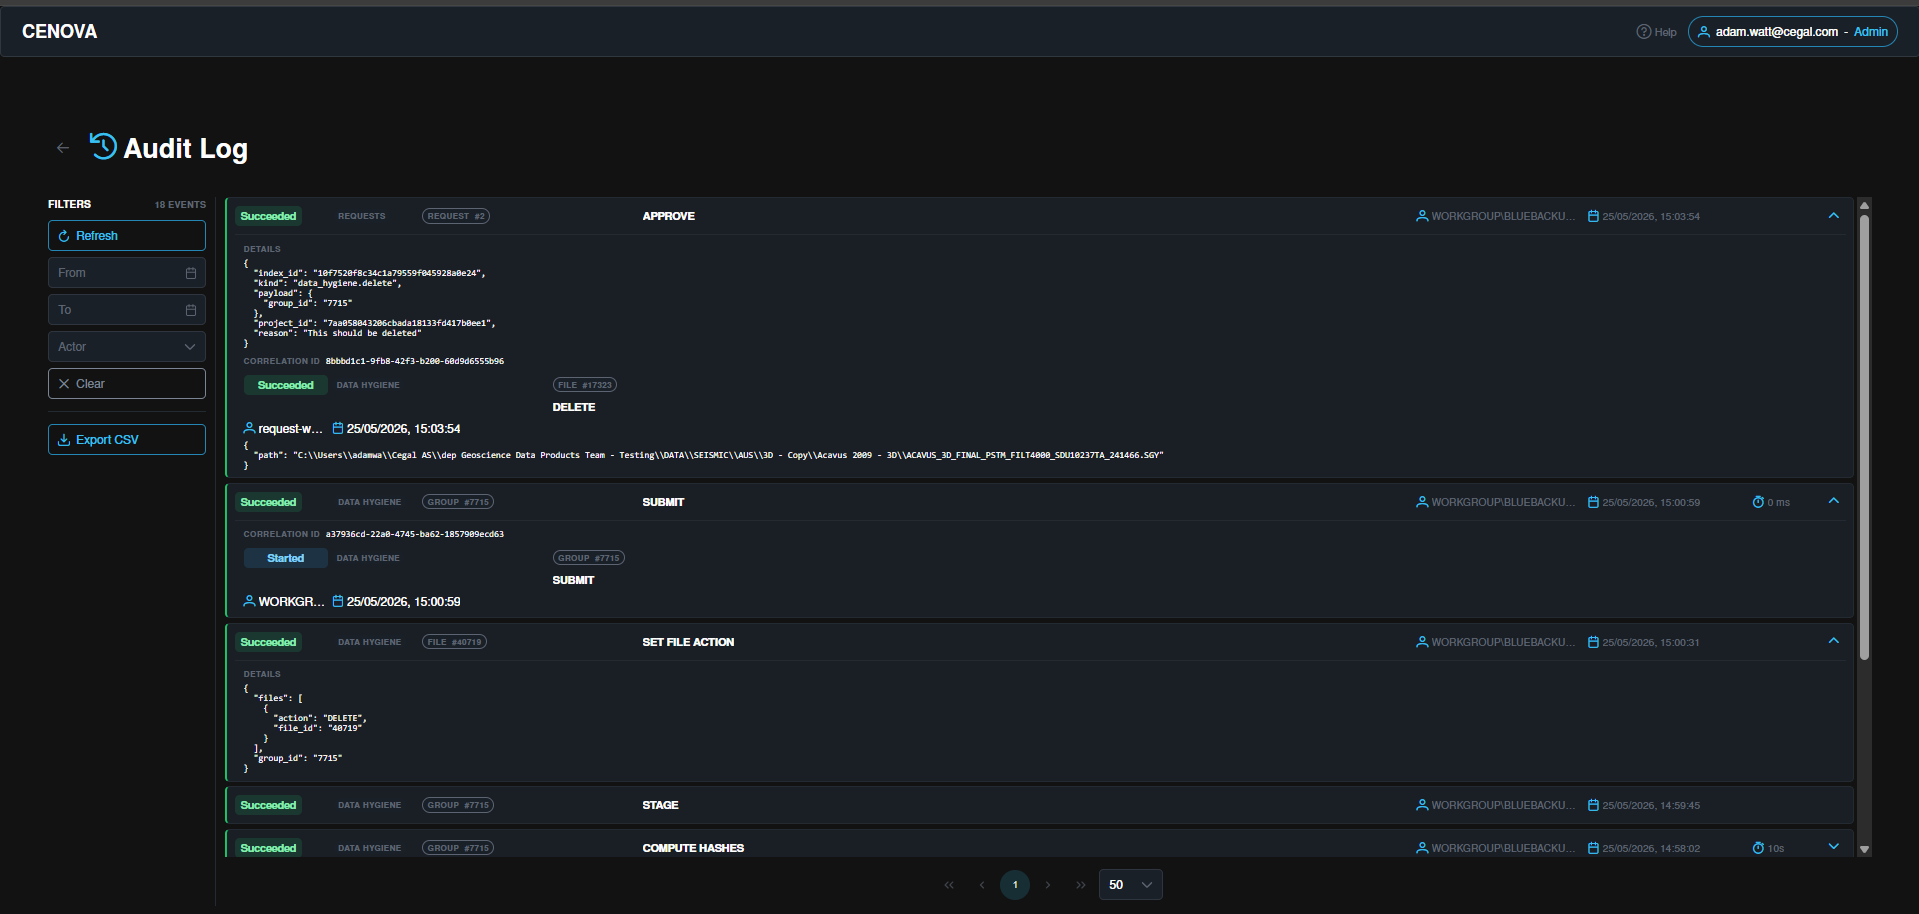
- Every step is captured in a searchable, exportable Audit log.
Seismic duplication at a glance
The block diagram below summarises the end-to-end path a seismic duplicate group takes — from the moment Cenova first clusters look-alike files, through MD5 verification and admin approval, to the reclaimed disk space and the audit record left behind. Each step maps directly to the numbered workflow above.
- Scan & cluster — scheduled Edge scans index SEGY/SGY/ZGY files and group look-alikes by name, size, and path signature. Smart exclusions (VSP, checkshot, Hampson Russell
.dir) keep known false-positives out of the candidate list. - Review groups, largest first — the Seismic dashboard sorts duplicate groups by reclaimable size, so reviewers always start where the savings are biggest.
- Verify with MD5 — a byte-level hash is computed for every file in the group. Only groups whose hashes match are eligible for staging; anything else stays untouched.
- Stage files — reviewers tick the specific copies to remove. At least one file per group must remain — Cenova will not let you empty a group.
- Submit & approve — the request goes to an Admin (by default, someone other than the requester). A pre-delete modification check runs before anything is removed, so files changed since staging are aborted automatically.
- Delete & log — approved files are deleted and the space is reclaimed. Every action along the way — verification, staging, request, approval, deletion — lands in the searchable, exportable audit log.
7.1 Review duplicate groups
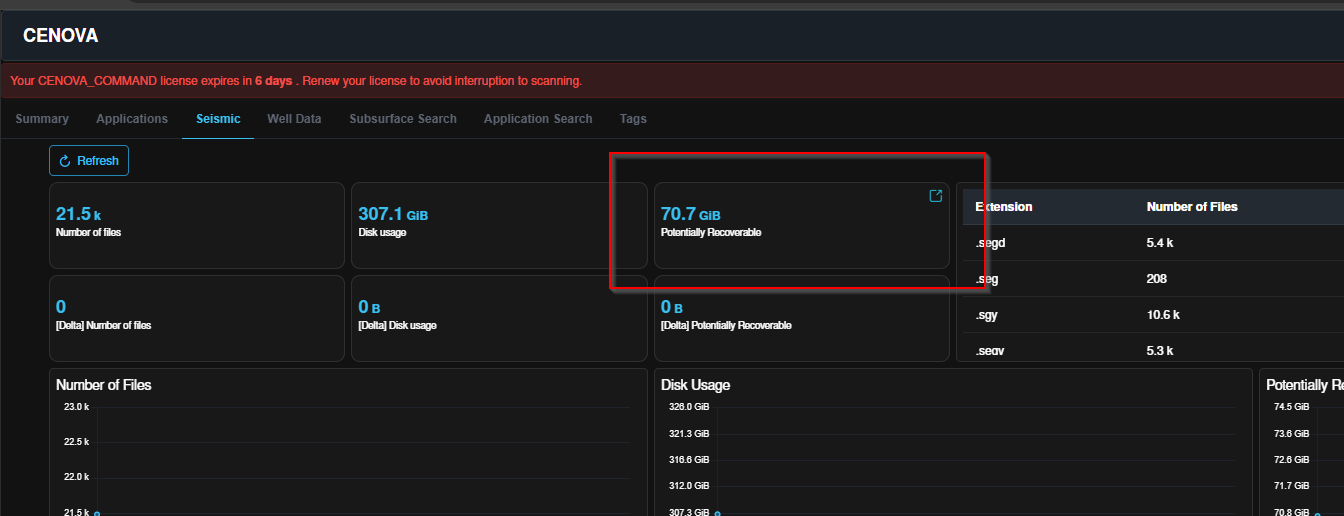
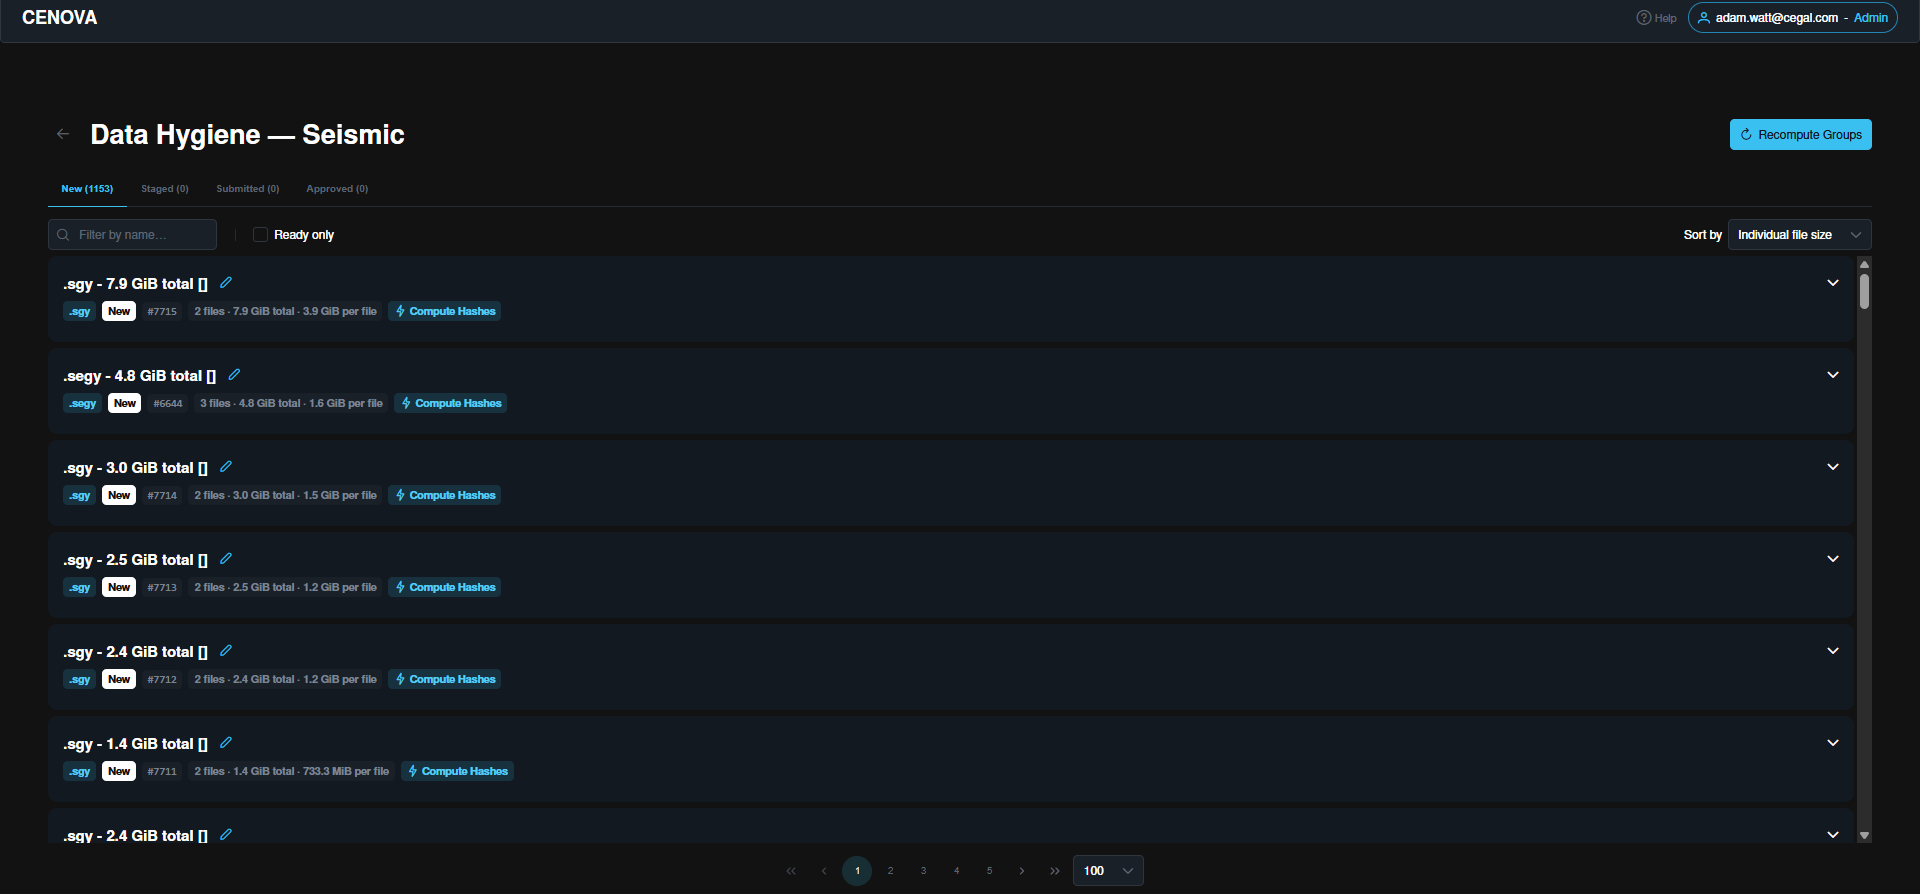
Open the Potentally Recoverable tab on the Seismic or Well Data dashboard. Cenova clusters files that look identical (by name, size, and path signature) into duplicate groups, sorted from largest to smallest by total reclaimable size — so the biggest wins are always at the top of the list.
For each group you can see:
- How many files are in the group
- The total disk footprint of the group
- The per-file name, size, and path so you can tell where each copy lives
This view is read-only by design. Nothing is staged or deleted from here — its job is to help you decide which groups are worth a closer look.
7.2 Verify before acting
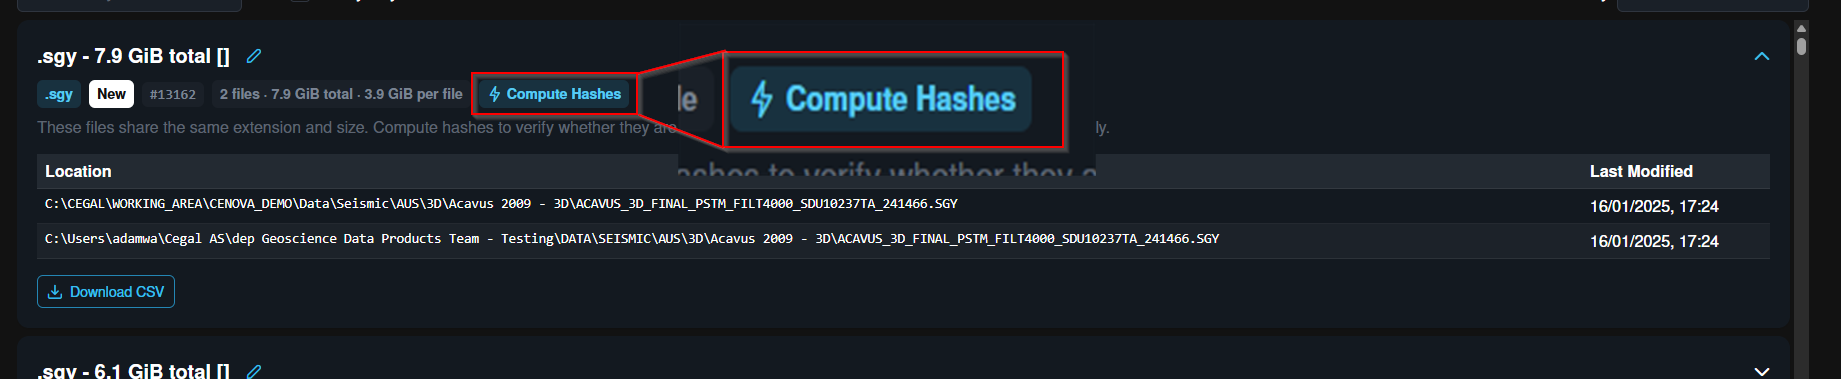
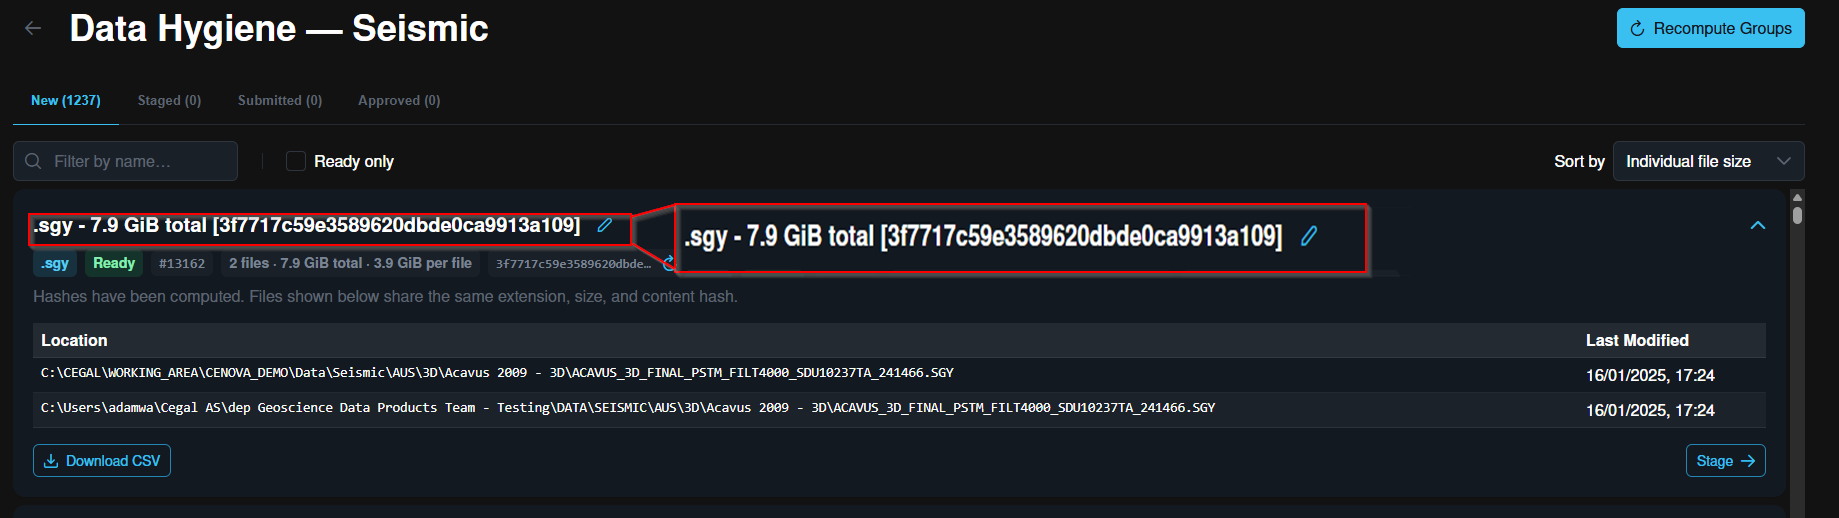
Before any file in a group can be staged for deletion, the group must be verified. Verification asks Cenova to compute an MD5 hash for every file in the group and compare them, so you know the files are byte-for-byte identical — not just similar-looking.
Triggering verification is a manual, per-group action. Cenova shows a confirmation before it starts, and clearly marks groups that have already been compared so the team can pick up where the previous reviewer left off without re-hashing large files.
You can also batch compute groups — select multiple duplicate groups and verify them together in a single action, rather than kicking off each one individually. Cenova queues the selected groups and computes their MD5 hashes in turn, so you can set several large groups verifying and move on. As with single-group verification, results are cached against each group once complete.
What is an MD5 hash?
An MD5 hash is a short, fixed-length "fingerprint" (32 hexadecimal characters) calculated from the full contents of a file. Cenova generates it by streaming every byte of the file through the MD5 algorithm — so the hash depends on the actual data, not the file name, path, size, or timestamps.
Two files with the same MD5 hash are, to a very high degree of certainty, byte-for-byte identical. Two files with different hashes are guaranteed to differ somewhere in their contents. That makes MD5 a fast, reliable way to confirm true duplicates before anything is staged for deletion.
Because the hash is computed over every byte, verification of very large seismic volumes can take some time — but the result is cached against the group, so it only needs to be done once.
NOTE
Smart exclusions are built in. SEGY files inside Hampson Russell .dir folders, and files whose names contain vsp or checkshot, are skipped during duplication detection to avoid false positives.
For well data, if a duplicate file may belong to another study, both the requester and the approving admin are informed before the deletion is approved — helping prevent the accidental loss of study-related data.
TIP
Verification can be slow for very large seismic volumes. Verify the biggest groups first — that's where the biggest savings sit, and once verified the result is cached for everyone else reviewing the group.
7.3 Stage files for deletion
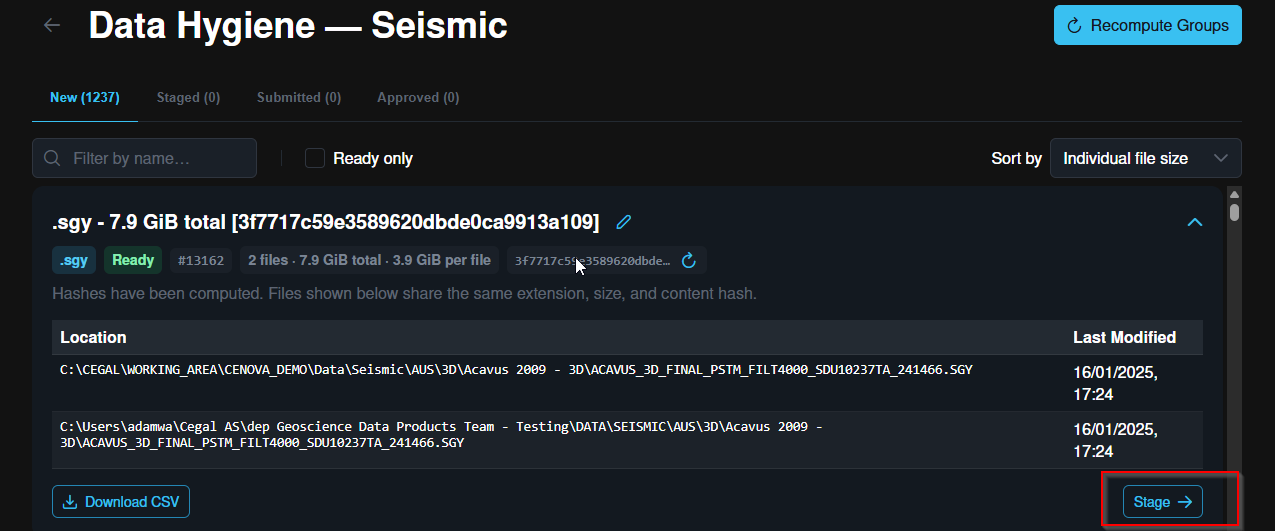
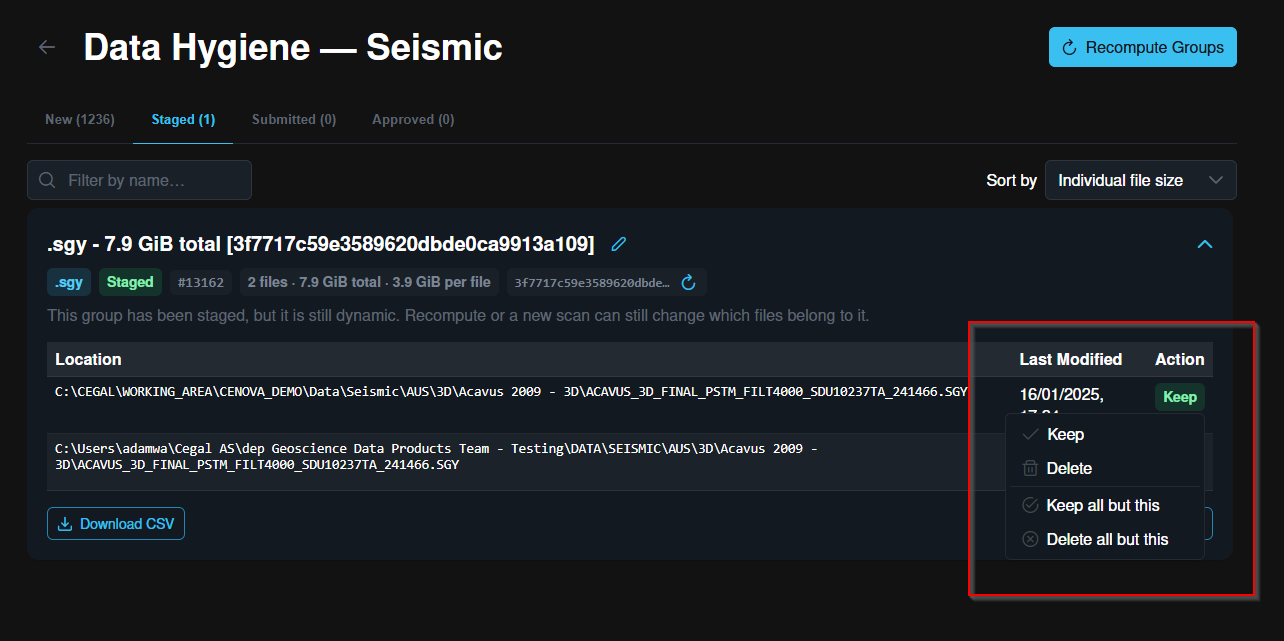
Once a group is verified, open it and tick the files you want to remove.
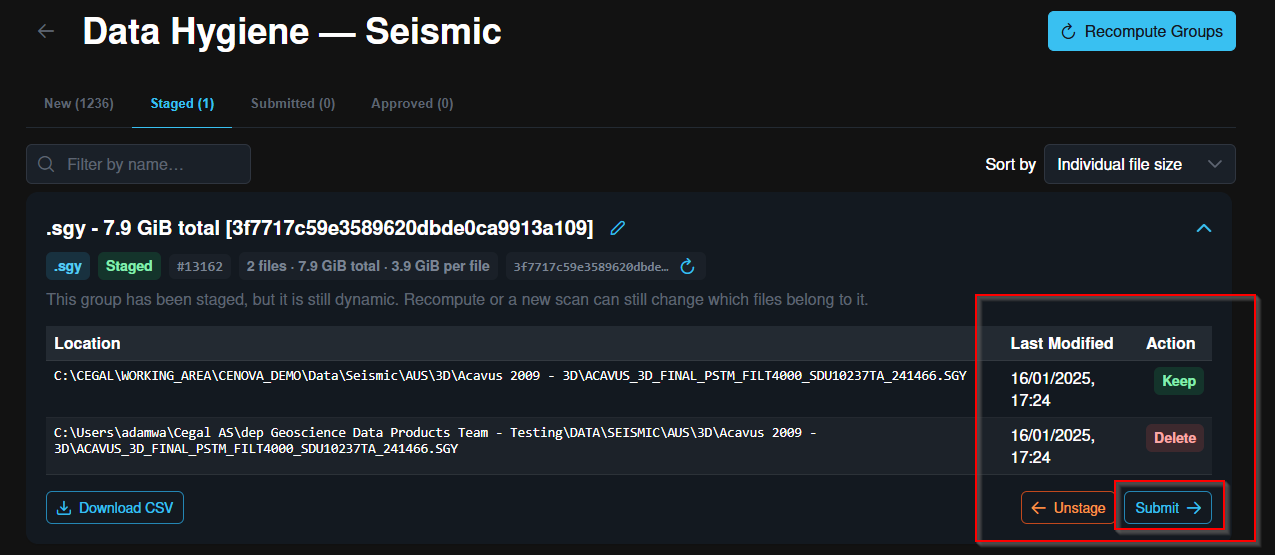
Staging is a proposal, not a deletion. Nothing leaves disk yet. The selection is held against your user and sent forward as part of a deletion request.
7.4 Approval workflow
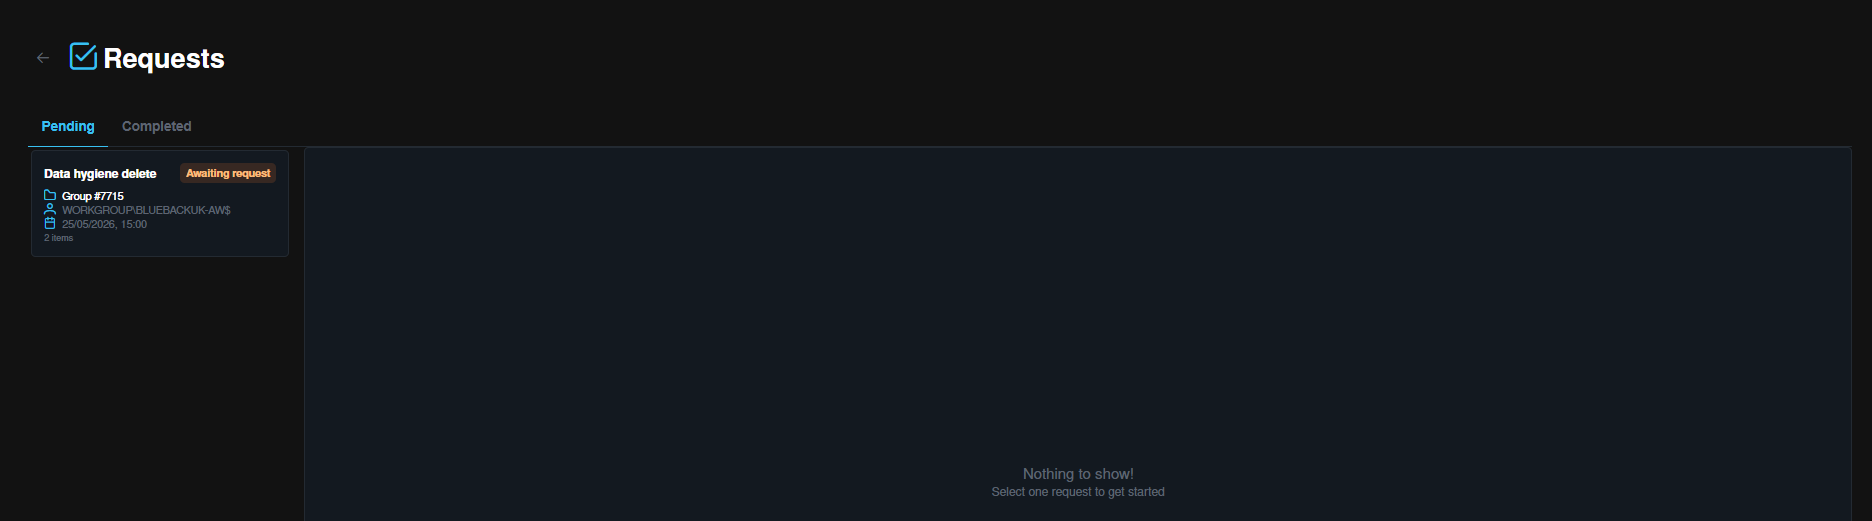
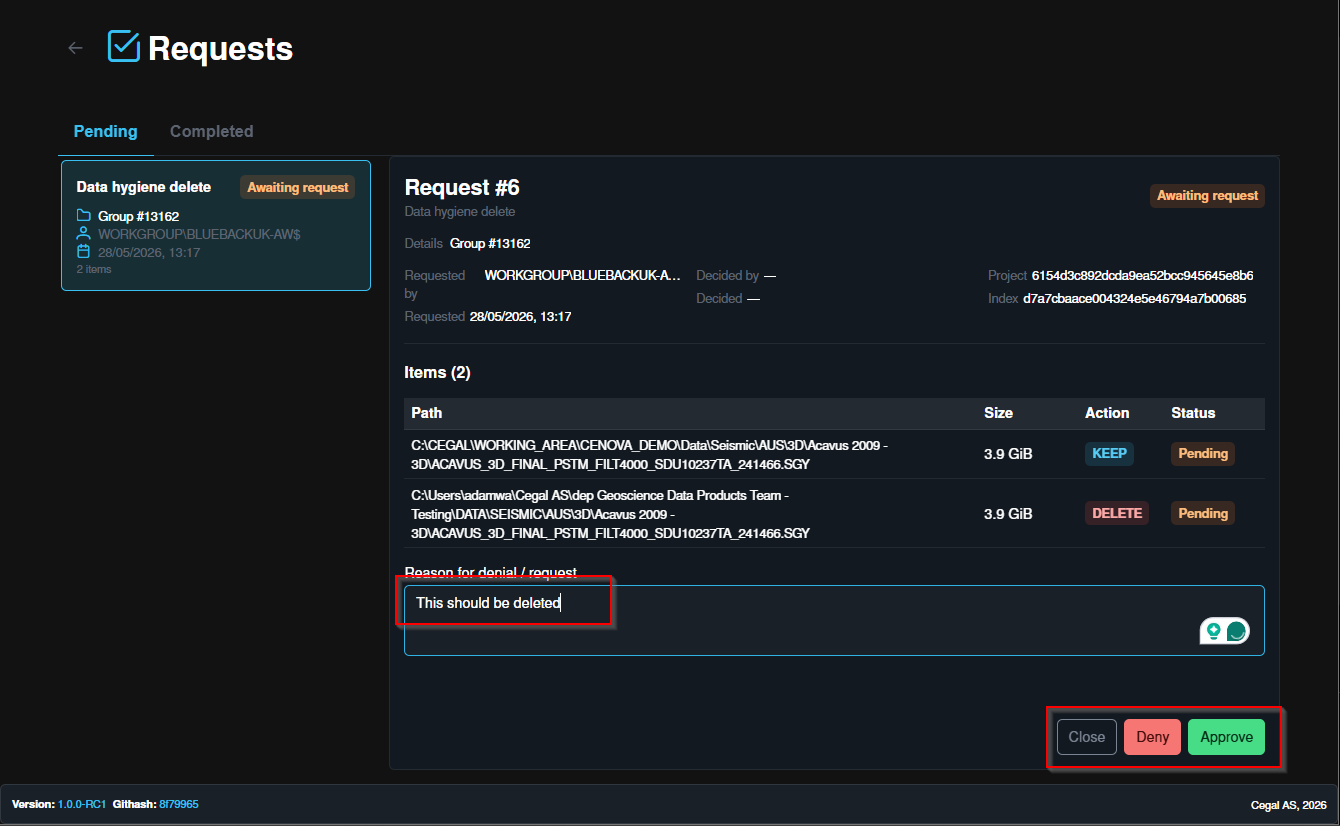
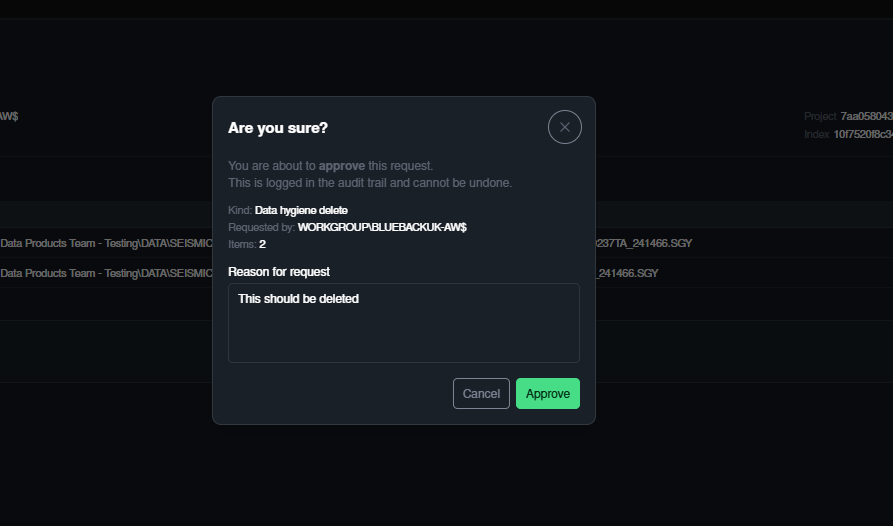
Submitting staged files creates a Request that appears in the Requests view in Admin. From there, an administrator reviews the request and either approves or denies it.
Three controls keep this safe:
- Mandatory modification check — at the moment of approval, Cenova re-checks every file in the request. If a file has been changed on disk since the request was raised, that deletion is blocked, even if the request itself was approved.
- Distinct request approver — a system-wide preference that controls whether the same user can both raise and approve a request. It defaults to On (requester and approver must be different users) to enforce separation of duties. See Preferences.
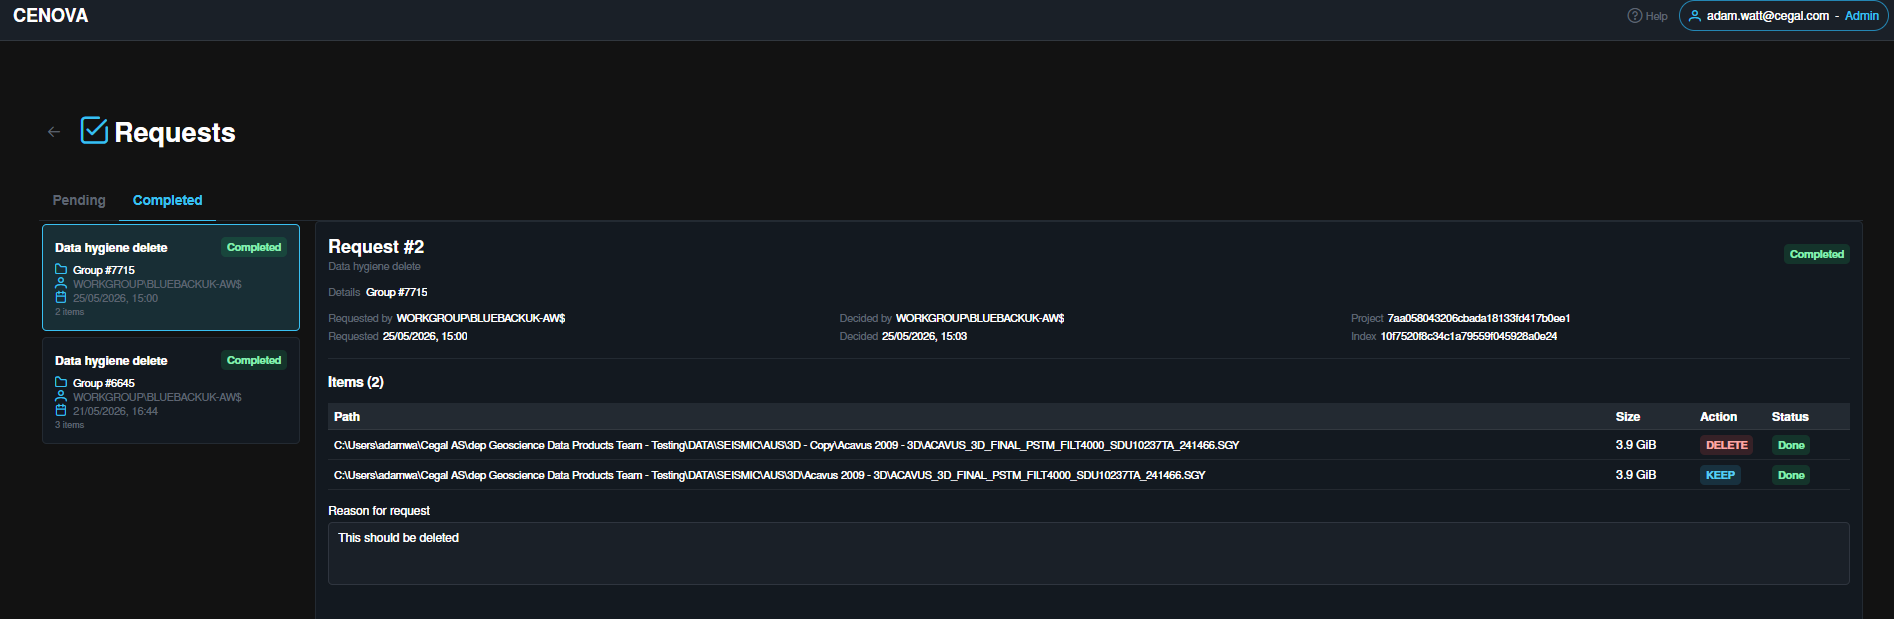
Pending and completed requests stay visible in the Requests view so you always have a single place to see what is in flight.
7.5 Audit history
Every Data Hygiene action — verification, staging, submission, approval, denial, and the actual deletion — is recorded in the central Audit log. Each entry captures:
- What — file name, type, path, and size
- Who — requester and (where applicable) approver
- When — request date and decision date
- Why — the reason given by the requester, plus any denial reason
The log is searchable (by user, file, action, date range), filterable, and exportable in full or filtered form — useful for compliance reviews, internal handovers, or simply reconstructing what happened to a specific file. Retention is configurable by an administrator (days, months, or years).
8. Subsurface Search
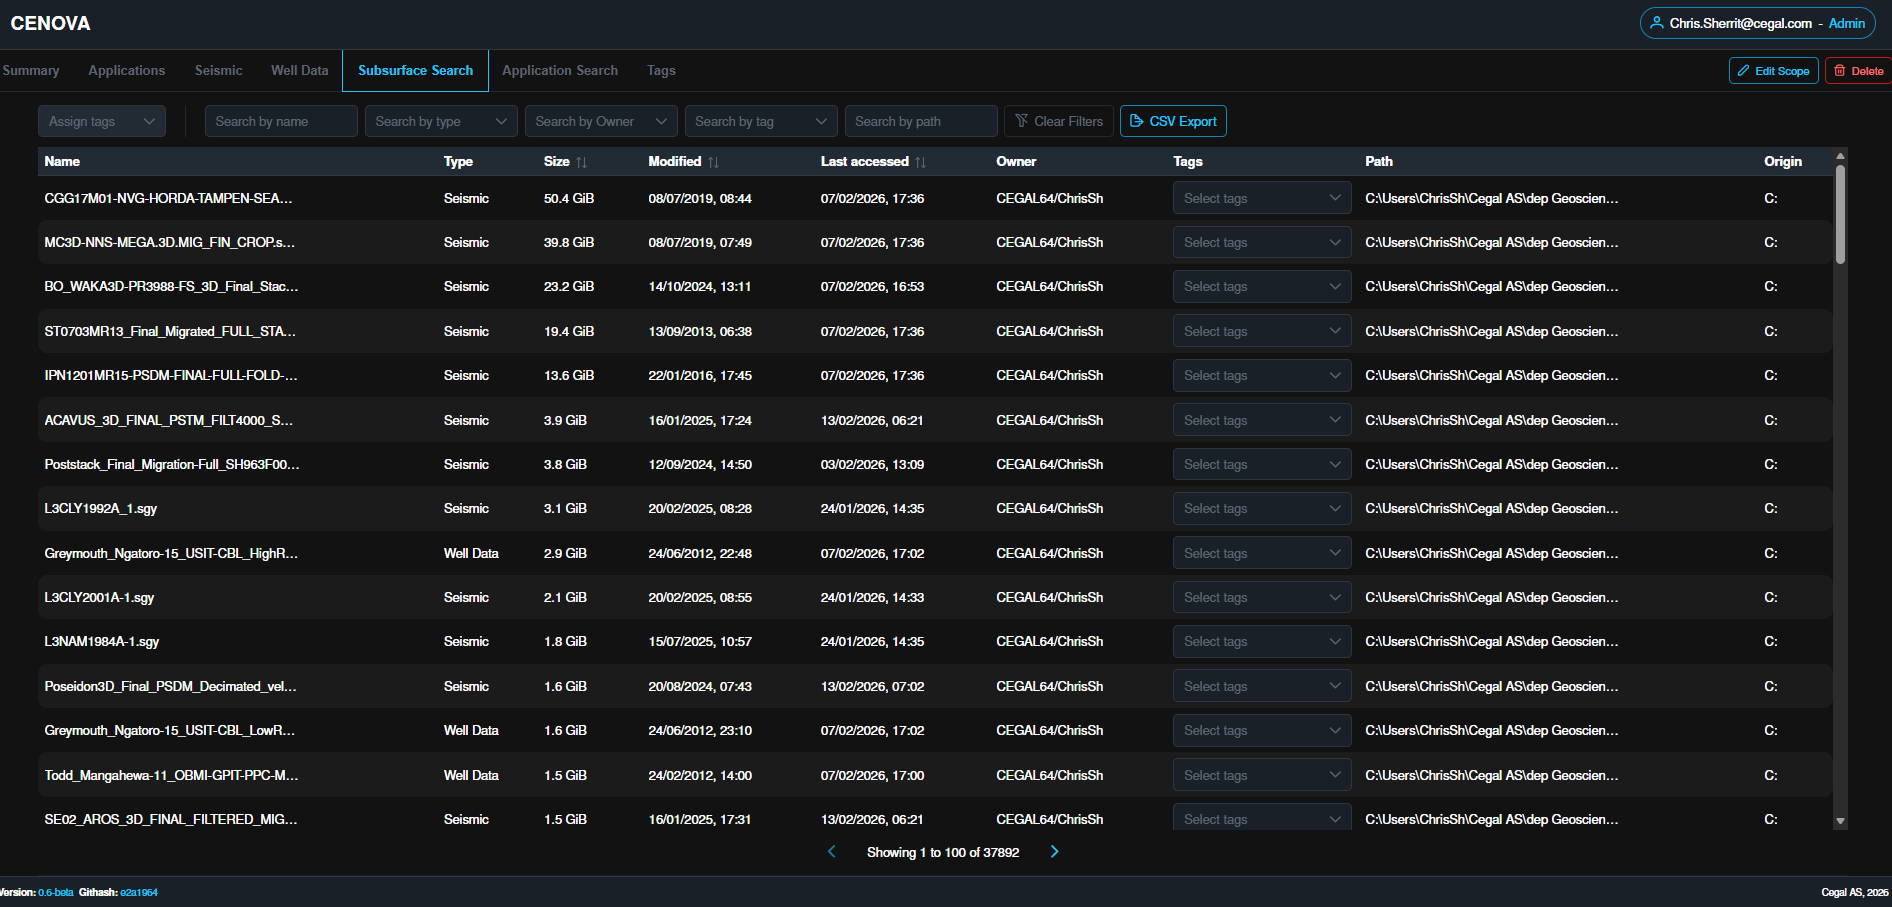
Locate and review subsurface files (seismic or well) with flexible filtering and tagging.
Columns
| Column | Description |
|---|---|
| Name | File name. |
| Type | Data category (e.g. Seismic). |
| Size | Total file size. |
| Modified | Last modified date/time. |
| Last Accessed | Last opened/read date/time. |
| Owner | User associated with the file. |
| Tags | Add or manage tags directly from the row. |
| Path | Full directory location. |
| Origin | Source drive or storage location. |
Sorting is available on Size, Modified, and Last Accessed.
Filters
| Filter | Description |
|---|---|
| Search by Name | Full or partial file name. |
| Search by Type | E.g. Seismic or Well. |
| Search by Owner | Files owned/created by a specific user. |
| Search by Tag | Files with specific tags. |
| Search by Path | Files within a directory or path. |
Combine multiple filters to drill into specific datasets.
9. Application Search
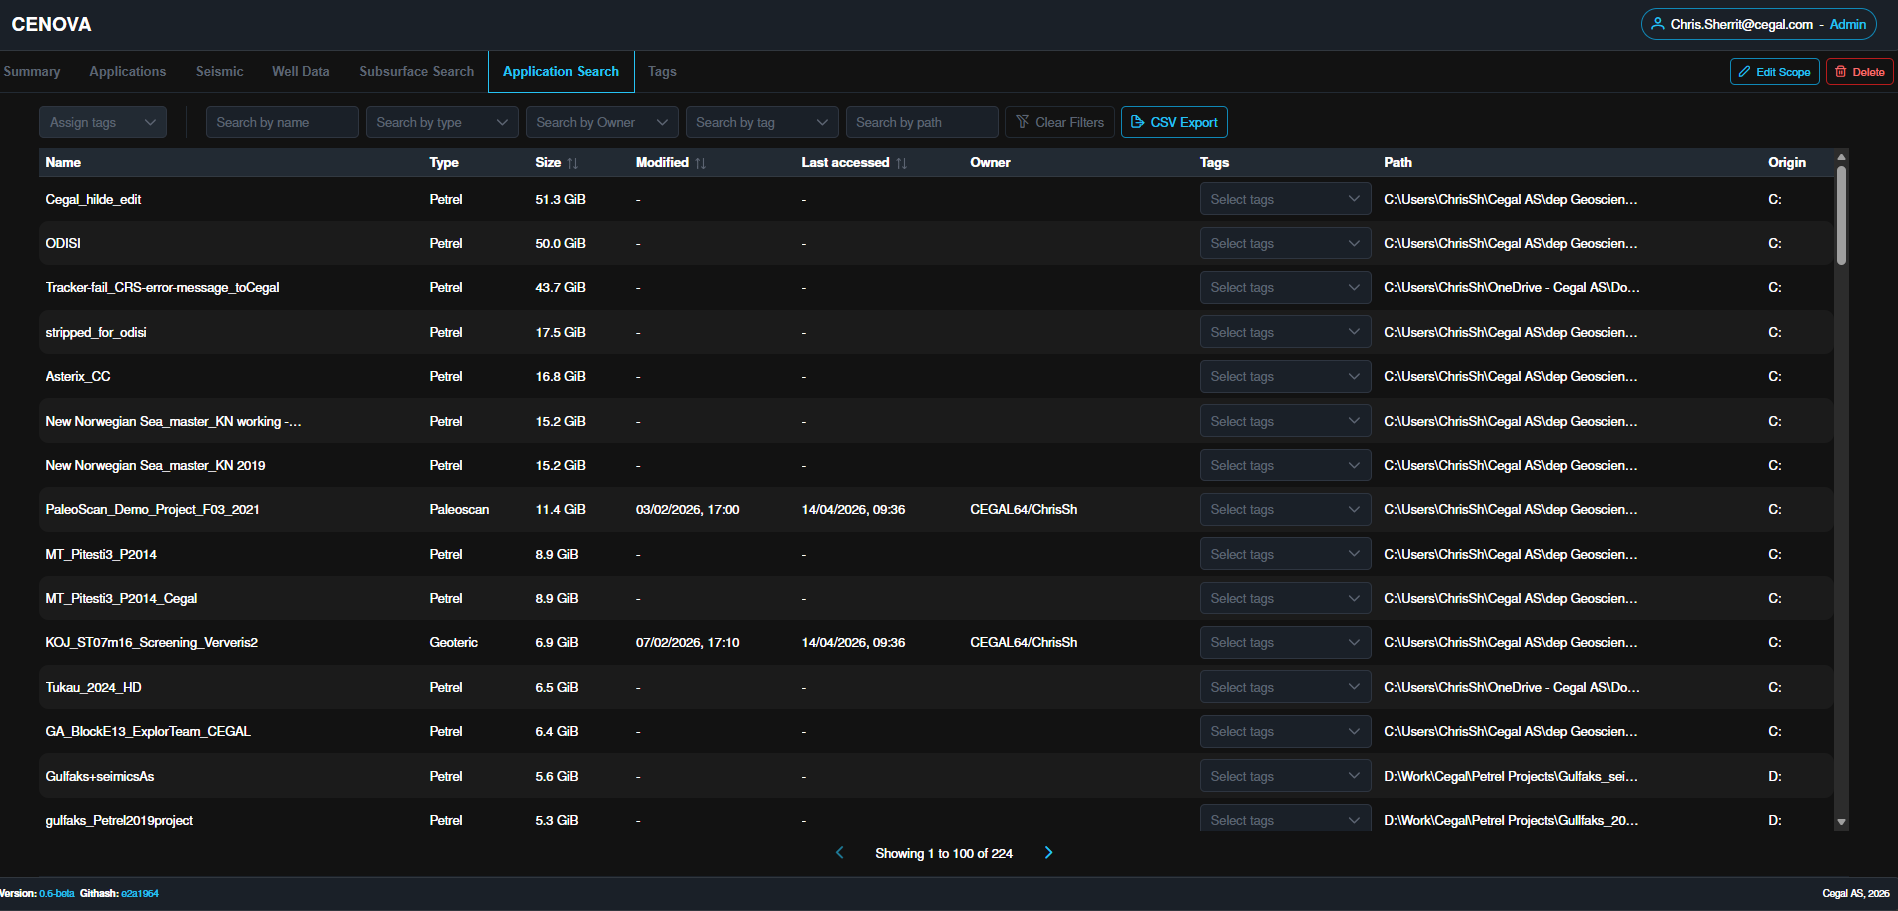
Explore and manage application projects (e.g. Petrel datasets) with detailed metadata, filtering, and tagging.
Columns
| Column | Description |
|---|---|
| Name | Project name. |
| Type | Application type (e.g. Petrel). |
| Size | Total project disk size. |
| Tags | Add or remove tags. |
| Path | Project location. |
| Origin | Source drive or storage. |
Sorting is available on Size.
Filters
| Filter | Description |
|---|---|
| Search by Name | Full or partial project name. |
| Search by Type | E.g. Petrel, Prosper, MBAL. |
| Search by Tag | Projects with specific tags. |
| Search by Path | Projects within a directory or path. |
10. Tags
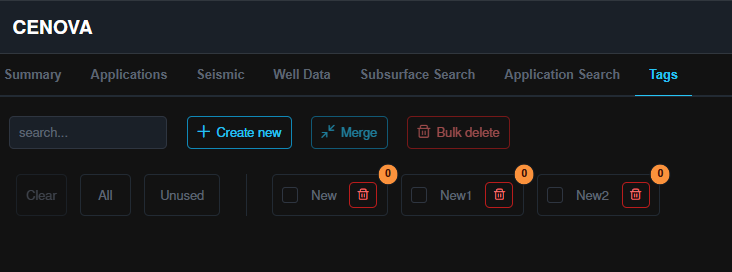
The Tags view is the central place to organize tags across all data domains (Seismic, Well, Applications, …).
10.1 Search
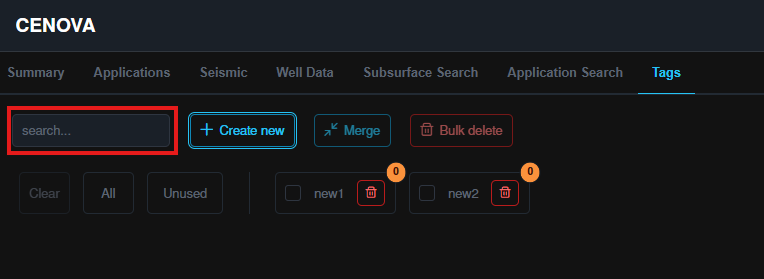
Use the search bar to find existing tags quickly.
10.2 Create new
Click  , enter a name, and click Save.

10.3 Merge
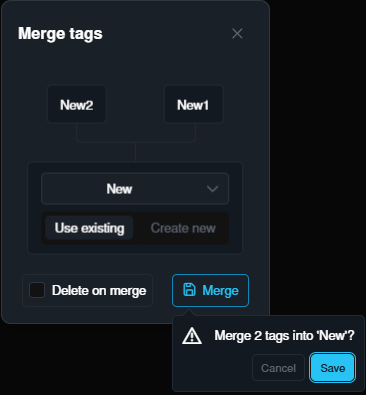
Combine multiple tags into one to reduce duplicates and keep naming consistent. You can merge into a new tag or into an existing one.
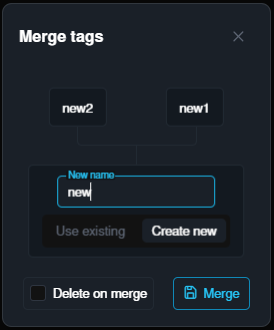
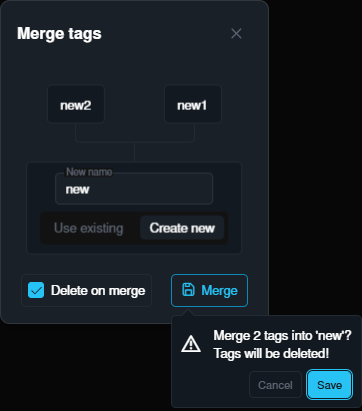
The  toggle controls what happens to the source tags after the merge:
On → source tags are removed after merging:
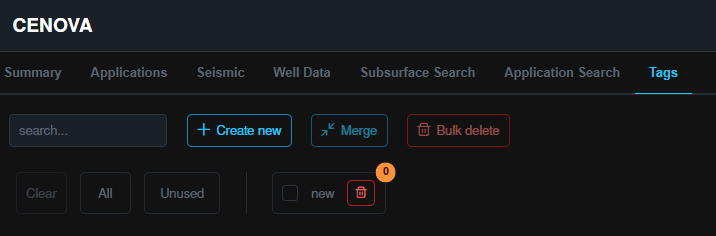
Off → source tags remain alongside the merged tag:
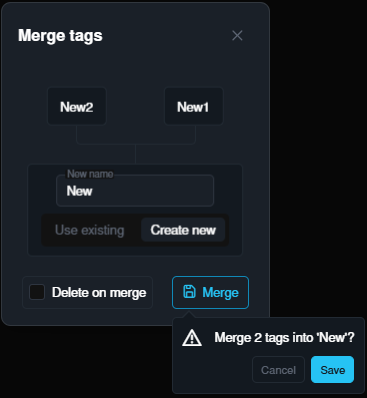
A dropdown lets you merge into an existing tag instead of a new one:
10.4 Bulk delete
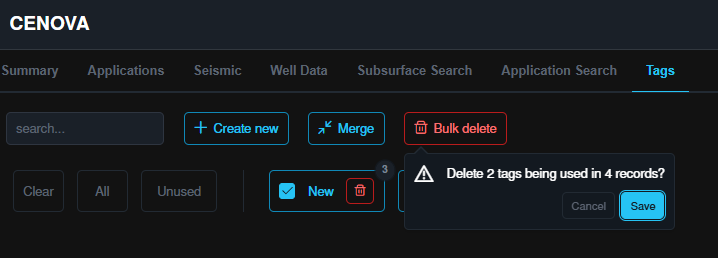
Removes selected tags and unassigns them from all associated items.
10.5 Selection helpers
| Option | Description |
|---|---|
| Clear | Clear all selections. |
| All | Select every tag. |
| Unused | Select tags not assigned to any item. |



10.6 Tag list
| Field | Description |
|---|---|
| Tag name | The name of the tag. |
| Usage count | Number of files / projects using it. |
| Delete | Permanently removes the tag. |

TIP
Tags updated or deleted here automatically update across Subsurface Search and Application Search.
Where to next
- Revisit the product tour in How it works.
- Start a fresh scan via the Pre-Assessment guide.
- Need help? See Support.
- See what's planned next on the Roadmap.